Remember 2019? It was the last normal year before the world decided to binge-watch a global health crisis.
Analyzing the gaming capital now is like comparing a pre-digital rolodex to a CRM powered by AI. The core function is the same. But the mechanics, expectations, and data points have fundamentally evolved.
Nevada’s roaring comeback is our baseline. The state just reported its third straight year of gaming revenue over $14 billion. This boom is fueled by resurgent tourism, new resort openings, and the return of international travelers.
This isn’t just a local story. It’s like the European tech scene’s “Third Wave.” That’s the post-2020 shift toward intentional, globally-minded structures. The pandemic impact on the casino industry triggered a similar, profound reset.
So, what does “recovery” really mean when the people returning aren’t the same ones who left? We’re about to dissect the before-and-after with the glee of a cultural anthropologist.
Baseline visitor composition 2019
The 2019 Las Vegas visitor was like a control group in a big experiment. They were the Transplant, a predictable figure against which all changes were measured. This wasn’t just any tourist.
The first wave of European tech was all about moving to Silicon Valley. It was the same with Vegas visitors before the pandemic. They didn’t just visit; they moved their whole leisure life there for a weekend.
So, where did these visitors come from? The data shows a clear picture. North America’s big share of the slot machine market was built on the Strip. This was a mature gaming scene, fed by domestic flyers.
The classic 2019 visitor flew in from a major hub. They booked a room on the Strip and followed a set plan. This plan included premium gaming, shows, and steak dinners. Their spending was predictable, thanks to a strong economy before 2020.
This crowd was often older and had more money. They saw Vegas as a destination, not just a stop on a list. They stayed for three to four nights, making the most of their weekend.
Why is this baseline important? You can’t track changes if you don’t know the starting point. Every shift today is a change from 2019. The Strip is now adapting to these new changes.
Understanding the “pre-pandemic normal” is key to analyzing Las Vegas recovery trends. The Transplant Era is over. But to understand the new visitors, we must study the past.
Current demographic breakdown 2024
Finding the ‘average’ Vegas visitor in 2024 is tough. The crowd has split into many groups. Gone are the days of a single type of visitor.
Now, people come for many reasons. They want both fun and relaxation. This mix is what makes Vegas exciting today.
Remote work has changed how we think about vacations. People now blend work and play. This is known as “bleisure.” It means longer stays in Vegas.
Digital gaming has also changed things. Players want the same fun online as they do in casinos. This has made casinos more tech-friendly.
Let’s look at the new faces in Vegas:
The Bleisure Gambler: They spend money on work and play. They value flexibility.
The Cashless Spender: They prefer digital payments. They see cash as old-fashioned.
The Experience-Chaser: They want more than just games. They seek luxury and unique experiences.
This last group is key. They see casinos as part of a bigger experience. This changes how casinos make money.
These changes make it hard to understand spending patterns. Domestic and international visitors have different budgets and needs.
We can’t talk about just one type of visitor anymore. We see a mosaic of different people. Each one has their own reasons for visiting. Resorts need to cater to all these groups.
Key shifts and changes
Forget the old playbook—the post-pandemic Las Vegas recovery trends show a new landscape. It’s shaped by technology, timing, and changed traveler psychology. What’s the big change? It’s a major shift in who visits, how they spend, and what they expect.
The most visible change is the end of coin buckets. Cashless technology in casinos and amusement venues is now the norm. It’s not just about being convenient. It’s a big change in how we pay, speeding things up and giving marketers valuable data. Goodbye, anonymous gambling; hello, hyper-targeted hospitality.
This digital leap is part of a bigger trend. Now, 64% of companies expand to the U.S. at an early stage, up from 33% before. Visitors are planning trips sooner, with more certainty. The hesitation is gone, replaced by a bold, “let’s go” attitude.
The visitor map has changed, too. The balance between domestic and international visitors has shifted. While international gates are opening, a domestically-heavy crowd now leads. This isn’t a failure; it’s a smart move. The appeal of a Vegas trip has changed.
It’s not just about cheap buffets and rooms anymore. The new draw is unique experiences, personalized service, and value. Casinos that thrived didn’t wait for the past to return. They used AI to understand the new visitor and created a new normal. The Las Vegas recovery trends show a story of adapting, not looking back.
At the heart of it all is a change in mindset. The city’s comeback is thanks to those who analyzed the changes and built better foundations. The post-pandemic Las Vegas is not a copy; it’s an improvement.
Geographic Origin Analysis
Forget the old atlas. The map is being redrawn.
The classic fly-in markets from the East Coast and Midwest are key. But the post-pandemic recovery showed us who’s essential. It was a lesson in who to keep and who to let go.
So, which regions bounced back first? Here’s a spoiler: domestic drove the bus. This is the era of the “Magnet” archetype. Companies didn’t just pivot to the U.S. market; they were pulled into its orbit as the primary source of energy.
It’s a tale of two timezones. American travelers became the dominant gravitational force. Their spending provided the stability needed for survival.
Across the Pacific, the Asia-Pacific region is booming. Rapid urbanization and an expanding middle class are fueling this engine.
This isn’t just a blip. It signals a possible long-term demographic shift in where the international crowd originates. The pendulum is swinging, but slowly. We’re analyzing the new coordinates of global demand.
Domestic vs international recovery patterns
Looking at Las Vegas recovery trends is like comparing a slot machine jackpot to a poker pot. One is quick and loud, the other slow and complex. This shows the difference in how places recover after a pandemic.
The domestic rebound was explosive. People wanted to travel again, and fewer rules made it easier. Visitors from places like California and Texas came back fast. This created a cycle of easy, repeat visits.
But international recovery was slower. It was like a careful craps strategy. Visa rules, flight changes, and health checks made it harder. While locals came back fast, international visitors were slower to return.
Has the pandemic impact casino industry made Vegas visitors more local? Yes, for now. Easy travel within the US made it the go-to choice. But it’s not a permanent change.
Places like Macau and Singapore are also big players. They offer great gambling and strict rules. Vegas is up against these places, not just its own past.
So, what’s next? Domestic visits have set a new standard. International visitors are coming back, but slowly. The real test is when both groups come back fully. Will Vegas keep its appeal, or has the pandemic changed things? Only time will tell.
Regional market penetration changes
Looking at where visitors come from now is like reading a complex map after a big change. The post-pandemic Las Vegas visitor base didn’t just come back; it changed its layout. Let’s explore the new tourism hotspots.
Vegas is in a mature market. North America leads the slot machine and amusement machine markets. The real fight is now within the country, region by region.

So, which regions won and which lost? The data shows a shift towards economic and practical choices. The Sun Belt’s growth was expected to bring more visitors. But what about the cash-rich Northeast corridor? The change in visitor demographics is a story of different Americas.
| Region | Pre-Pandemic Strength | Post-Pandemic Shift | Primary Driver |
|---|---|---|---|
| Sun Belt (TX, AZ, CO, UT) | Strong & Growing | Accelerated Dominance | Population/economic boom, direct flight hubs |
| Pacific Northwest (WA, OR) | Moderate | Notable Decline | Remote work culture, reduced corporate travel |
| Northeast Corridor (NY, NJ, CT, MA) | Premium Core | Stable but Selective | High airfare sensitivity, value-seeking for long trips |
| Midwest (IL, OH, MI) | Loyal Base | Resilient Recovery | Drive-market reliability, consistent discretionary spend |
The table shows clear winners. The Sun Belt is an economic powerhouse for Vegas. More people, more money, and more flights create a cycle. The Midwest is steady, like a reliable voter.
The Northeast is interesting. It’s vital but visitors are more careful. They want to see the value of their weekend. This is like the “Anchor” in global gaming, a smaller but important part of the revenue.
The Pacific Northwest’s decline is surprising. Working from home didn’t mean working from Vegas. This region went from moderate to weak, a big change in market penetration.
The final analysis? The post-pandemic Las Vegas map shows power consolidation in regions with strong economies and easy access. The change in visitor demographics is about where they’re coming from. The regional battlegrounds have changed.
Travel distance impact on spending
Imagine a long flight to Vegas like moving to Silicon Valley for a startup. It’s a big step that should mean big spending. You’ve moved to a new place, even if it’s just the Strip. So, you should spend more, right?
But, post-pandemic data shows this isn’t true. The idea that flying far means spending more is fading. Does someone from New York really spend more than someone from Phoenix who drives for a weekend? It doesn’t seem to be the case.
This change is key to Las Vegas’s recovery. With trips getting shorter, the urge to spend big has changed. The long-distance traveler is important, but so is the local who comes often.
Casinos have adapted to this new reality. They offer games for all budgets. This way, they can attract both the big spenders and the budget-conscious visitors. They’re not competing; they’re both welcome.
So, what’s the new rule? Spending isn’t just about how far you travel. The long-distance traveler might have a bigger budget, but they might not spend as much each day. The local visitor, with less travel stress, might spend more on special experiences.
This complex behavior is key to understanding today’s gaming industry. It’s not just about where people come from. It’s about how their journey affects their spending. The recovery is not one-size-fits-all; it’s made up of different patterns.
Income Bracket Changes
Let’s talk about the new velvet rope. It’s not made of plush fabric, but of pure economic pressure. The post-pandemic economic landscape has reshuffled the deck for everyone, specially in the casino industry.
Inflation and market volatility aren’t just news headlines. They’re directly shrinking disposable income and travel budgets. This isn’t a local issue. A widening economic gulf between the US and Europe is pushing business elsewhere, while growth in Asia Pacific hints at a future demographic shift with higher-income international travelers.
So, what does this mean for the classic Vegas visitor profile? We’re moving far beyond the simple high-roller vs. low-roller story. The middle is being squeezed, expanded, and transformed all at once. Are we witnessing a “barbell effect”? Strong luxury on one end, resilient value on the other, with a hollowed-out center? To understand the future, we must follow the money.
Economic impact on visitor profiles
The real-time pulse of the American economy might be under the neon lights of the Las Vegas Strip. The visitor walking into a casino today shows the national and global economic mood. It’s a fascinating, high-stakes case study in human behavior.
Let’s start with the suits. Data shows US enterprises have larger technology budgets and are faster to buy from startups post-pandemic. This corporate spending resilience has a trickle-down effect. It means more business travelers and convention delegates with expense accounts are back on the scene. Their profile is less about penny-pinching and more about strategic networking, often with a company card handy for a high-limit table.
On the leisure side, a macro-trend is equally telling. The global amusement machine market grows in lockstep with rising disposable incomes and urbanization. Simply put, as people in cities have more spare cash, they’re more likely to spend it on leisure travel and entertainment. The post-pandemic Las Vegas is a prime beneficiary of this shift. It’s attracting a demographic that views a weekend at the slots not as a reckless splurge, but as a calculated part of their entertainment budget.
So, what happens when inflation headlines scream and consumer confidence dips? Does Vegas see more bargain-hunting or more “you only live once” splurging? The answer, brilliantly, is both. The market has bifurcated.
Value-seekers hunt for package deals and off-Strip hotels. While high rollers seem almost defiant, spending with a “treat yourself” mentality that defies gloomy forecasts. This duality is captured perfectly in two key metrics: hotel ADR (Average Daily Rate) and table game drop.
When ADR stays high despite economic anxiety, it signals a segment of visitors is willing to pay for premium experiences. When the table game drop—the total amount of cash exchanged for chips—increases, it reflects direct, discretionary spending on the casino floor. These numbers tell a richer story than any economic pundit on TV.
| Economic Driver | Pre-Pandemic Influence (2019) | Current Influence (2024) | Visitor Profile Impact |
|---|---|---|---|
| Corporate Tech Spending | Strong, driving steady convention traffic. | Resilient & growing, with faster adoption cycles. | Revived high-end business traveler; more tech-savvy delegates. |
| Disposable Income & Urbanization | Steady growth fueling leisure travel. | Accelerated in key markets, despite inflation pressures. | Expanded demographic of urban professionals viewing Vegas as accessible leisure. |
| Consumer Confidence Index | Generally high, supporting robust spending. | Volatile, creating a “split-mindset” among consumers. | Clear divide between value-focused visitors and experience-driven splurgers. |
| Hotel ADR (Average Daily Rate) | Consistently strong, correlating with high demand. | Remains elevated, indicating premium demand persists. | Filters for visitors with higher spending capacity, reshaping gaming industry demographics. |
The table above isn’t just data—it’s a character sketch. The modern Vegas visitor is a product of these converging forces. They might be a consultant whose firm just upgraded its software, or a couple from a booming metro area using a bonus check on a suite.
Ultimately, analyzing gaming industry demographics now requires this dual lens. You must look at the cards on the table and the economic headlines on the phone. The visitor profile has become a complex hybrid of corporate resilience, urban disposal income, and a psychological tug-of-war between caution and indulgence. It’s economic analysis, with a very telling side of blackjack.
Disposable income effects on gaming spend
Looking at gaming spend today is like learning a new language. “Disposable” doesn’t always mean you can spend it freely at the casino. The money is there, but getting it to the table is now a strategic move.
Think of a visitor’s budget like a mini corporate balance sheet. Every dollar is debated and prioritized. This is how the money is allocated.
The US enterprise software market is huge, more than double Europe’s. This shows how individual disposable income varies when entering casinos. Some have a lot to spend, while others have less. The pandemic impact casino industry has made this gap clear, turning the casino floor into a place where economic differences are seen.
So, where does the gambling budget go? The link between disposable income and gaming spend is strong. But now, a smaller part of the budget goes to slots and tables. More money goes to dinners, shows, and luxury shopping.
This is where tech meets human touch. AI systems analyze player behavior in real-time, creating personalized experiences. If you like certain slots or table limits, the system knows and can make your experience better. It’s not just about loyalty points; it’s about making the most of your emotional and financial investment.
The numbers show a clear shift in spending. The table below shows how visitor spending has changed, reflecting new priorities.
| Spending Category | Pre-Pandemic Allocation (%) | Post-Pandemic Allocation (%) | Key Driver |
|---|---|---|---|
| Gaming (Slots/Tables) | 65% | 52% | Value-Seeking & Risk Aversion |
| Dining & Beverage | 20% | 28% | Experience & Social Currency |
| Entertainment & Shows | 10% | 15% | Memorable Event Creation |
| Retail & Amenities | 5% | 5% | Stable, Discretionary Purchase |
This shift in spending shows how people value their money. They don’t just gamble; they gamble smart. They make lower bets but play longer, choosing games with better odds and using player club benefits. The money saved can go to other things, like a nice dinner.
This smart spending is key to Las Vegas recovery trends. The city’s success isn’t just about full floors. It’s about how money flows through the whole system. The house wins, but now it wins in many ways. Understanding this is vital for anyone watching the pandemic impact casino industry long-term.
Value-seeking behavior trends
If you think ‘value’ means ‘cheap,’ you’re playing a losing hand in today’s casino demographic landscape. The modern Las Vegas visitor is a sophisticated operator. They aren’t just looking for a discount; they’re engineering an optimized experience.
This is the era of the savvy, informed patron. Value-seeking now looks like using a resort app to book a spa treatment at a dynamic price. It’s leveraging player’s club points for a complimentary steak dinner. It’s studying video poker pay tables with the focus of a day trader.
This behavior maps perfectly to what we call the “Telescope” archetype. Think of them as customers who see the whole board. They might not have a massive physical presence in the U.S., but they navigate the system with precision. They use self-serve technology—apps, kiosks, digital wallets—to maximize every dollar and minute.
How does this manifest? Let’s break it down:
- App-First Navigation: Reservations, rewards tracking, and even game selection happen on a smartphone before they hit the casino floor.
- Points as Currency: Loyalty points are no longer an afterthought. They are a primary budgeting tool, traded for rooms, meals, and entertainment.
- Cashless is King: The link between digital wallets and rewards programs is genius. Every tap earns something, encouraging repeat play without the feel of spending ‘real’ money.
This last point is key. Cashless systems tied to loyalty programs don’t just facilitate spending; they manufacture loyalty. They turn a one-time visitor into a data point in a recurring cycle. This is a masterful tool for managing the new value-seeker.
The implication for visitor demographics change is profound. We’re not just seeing a shift in age or income. We’re seeing a shift in mindset. The expectation of a seamless, tech-enabled value hunt is now standard. It’s what defines a significant portion of the current gaming industry demographics.
This trend turns every guest into a mild-mannered analyst. They compare slot club benefits across properties. They know which games offer the best points multiplier. This informed value-seeking behavior forces casinos to compete on digital sophistication, not just pillow mints.
The old model rewarded blind loyalty. The new model rewards clever calculation. For the industry, understanding this isn’t a niche study—it’s the core of the modern visitor demographics change. The Telescope user is no longer a rare breed. They are the new baseline.
Length of Stay Trends
Remember the classic week-long Vegas blowout? It’s having an identity crisis. The “average” stay is officially dead.
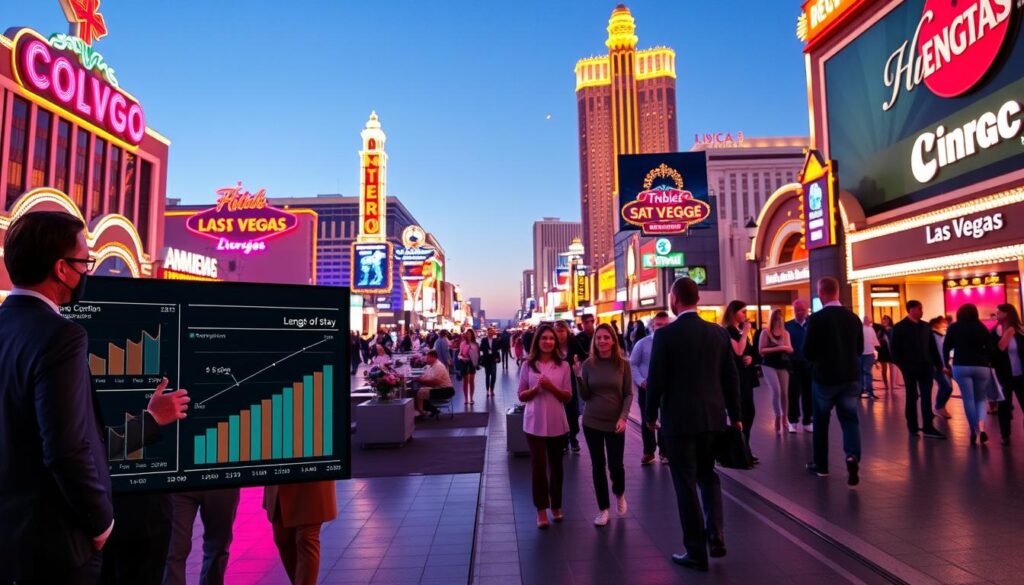
We’re seeing a fascinating change. On one side, the micro-trip: just three days, two nights. It’s a quick, intense experience. On the other, the macro-stay: a week or more. Here, work and play blend together.
This change reflects a corporate trend. Leaders move between extremes. Today’s visitor might travel between coasts or work remotely. The rise of remote work has fueled the “work-from-Vegas” trend.
This shift changes the city’s rhythm. It’s a big economic change. The old idea of an average length of stay: 3.5 is outdated. The real story is in the mix of quick visits and long stays. This mix is key to understanding post-pandemic Las Vegas and Las Vegas recovery trends.
Average duration analysis by demographic
A retiree from Omaha, a techie from Austin, and a convention-goer from Chicago all see Vegas time differently. Trying to find one “average length of stay” for everyone is like mixing apples and oranges. It’s a useless number that hides the real story of the pandemic impact casino industry.
So, what makes these different clocks tick? It’s a mix of money, purpose, and what they think is worth it. For example, a high-earner from San Francisco might see a Vegas weekend as a good deal. This can make a three-night trip feel like five.
Our Omaha retiree looks at time and money in a special way. They have plenty of time and want to get the most value. They’re not just visiting; they’re residing. Their stay is about stretching their vacation dollar.
Attractions also play a big role. New amenities like indoor go-karting aren’t just for fun. They can make a family add a day to their trip. This shows how visitor demographics change can affect how long they stay.
| Demographic Segment | Avg. Stay (Nights) | Primary Duration Driver | Relative Value Perception |
|---|---|---|---|
| Retiree (Midwest/Northeast) | 5-7 | Maximizing fixed income; ample leisure time. | Very High. Vegas offers bundled resort value. |
| Millennial Tech Worker (High-Cost Metro) | 3-4 | Relative luxury affordability; compressed leisure time. | High. Premium experiences cost less than home-city equivalents. |
| Convention Attendee | 2-3 | Fixed event schedule; employer-paid limits. | Low to Medium. Trip is purpose-driven, not value-seeking. |
| Family Group (with children) | 4-5 | Diversified attraction itinerary (shows, karting, pools). | Medium. Spending is fragmented across many activities. |
The table shows a clear difference. Convention attendees are like sprinters, with short stays. Tech workers and families are like middle-distance runners, with stays influenced by budget and experiences.
Retirees, on the other hand, are marathoners. They stay longer, creating a steady income for casinos, often during off-peak times. This means casinos can’t just market to one type of visitor. They need to cater to different lengths of stay.
Revenue per day calculations
Figuring out daily revenue is more than just numbers. It shows how visitors pack their fun into tight time slots. This metric is the pulse check for the whole Las Vegas recovery trends story. If stays are getting shorter, does the wallet open wider each day to make up for it?
Let’s look at the math. Revenue Per Day (RPD) is simple: total trip spend divided by stay length. But the story it tells is complex. A rising RPD means visitors are on a mission, spending a lot of money fast. A flat or falling RPD, with shorter stays, is a warning sign for revenue.
So, what’s the verdict after the pandemic? The data shows a split. For certain gaming industry demographics, like high-disposable-income visitors, RPD has soared. Their trips are more intense. They’re not just gambling; they’re splurging on everything from bottle service to high-end shows.
Technology plays a big role here. AI-driven insights are now real. Casinos use them for personalized marketing and to place machines better. This leads to more player engagement and higher daily spend. It’s like having a psychic croupier who knows your game before you do.
Then there’s the immersive layer. AR and VR technologies create deeper emotional connections. Imagine a slot game that feels like a story or a virtual poker table with real opponents. This makes gameplay more memorable and dynamic. A captivated player spends more per hour.
But not all segments spend like this. The table below shows who’s spending more per day and who’s pulling back.
| Visitor Demographic Segment | Pre-Pandemic RPD (2019) | Current RPD (2024) | % Change | Primary Driver |
|---|---|---|---|---|
| High-Income International (Asia-Pacific) | $1,850 | $2,400 | +29.7% | Premium Experience Seeking |
| Domestic “Value” Travelers (Drive Market) | $620 | $590 | -4.8% | Budget-Conscious Behavior |
| Mid-Tier Business/Leisure Blenders | $1,120 | $1,300 | +16.1% | Compressed Trip Intensity |
| Young Professional “Event” Visitors | $880 | $1,050 | +19.3% | Concert/Festival-Driven Spend |
The table shows a split in recovery. High rollers and experience-seekers are driving up daily revenue. But traditional value-seekers are being cautious, with slightly lower RPD due to inflation and economic worries.
This split is key to understanding today’s gaming industry demographics. The market is dividing into intensity clusters. Operators now focus on “revenue density”—how much money can be made from each square foot of casino floor per day from each visitor type.
The psychological shift is real. Those with limited time but plenty of money are spending big upfront. For the broader market, daily spend has leveled off, making overall trip revenue utterly dependent on stay length.
Ultimately, the Las Vegas recovery trends in revenue are driven by those who spend a lot per day, not just those who stay long. The future belongs to properties that boost daily spend through tech, personalization, and unforgettable experiences. The math is simple. But the strategy is a high-stakes game of psychological chess.
Extended stay vs short visit patterns
Casino marketing teams now focus on two main types: the Pendulum and the Magnet. This isn’t about stars. It’s about how the pandemic has changed who visits casinos. The Pendulum stays for a long time, while the Magnet comes for a quick visit. Let’s look at each.
The Pendulum is your long-stay visitor. Think of a European CEO who plans a whole trip around one place. They’re not just visiting; they’re residing. They book suites for a week and explore slowly.
After the pandemic, this type has become more popular. With remote work, why not stay at a casino resort? The Pendulum looks for stability. They spend on lodging, dining, and gaming over many days. Casinos offer them packages and guides to local experiences.
The Magnet is your short-visit guest. They come for a concert, fight night, or a quick layover. The growth of amusement machines in malls and hotels targets this group. It’s opportunistic entertainment.
The Magnet wants excitement and leaves quickly. Their spending is high but short-lived. Casinos aim for volume and ease with this type. They want to catch them where they are and make it easy to spend.
Which pattern is better for casinos? It’s a story of slow and steady versus quick wins. The Pendulum might spend more over time. The Magnet spends more per day but leaves fast. Casinos aim to attract both.
Modern casinos aim to please both types. They create resorts for the Pendulum and offer quick games for the Magnet. This shows the industry’s shift after the pandemic. It’s not just about getting people in. It’s about keeping them there.
Knowing these patterns is key. It affects everything from building to staffing. Casinos need to offer experiences for all types of visitors. Time is the most valuable thing every visitor brings.
Seasonal Variation Analysis
Remember the old tourism calendar? Toss it. It’s as useful as a snowblower in July. Post-pandemic Las Vegas has changed the game.
Summer heat and New Year’s Eve are key. But what about the gaps in between? Have the old shoulder seasons disappeared?
Look at the numbers. Indoor attractions like go-karts are open all year. This shows a push for steady visits, not just peaks.
But mega-events bring their own magic. They create a “flywheel of serendipitous connections.” A big event pulls people in, making its own peak.
So, which way is Las Vegas heading? Is it becoming a steady, year-round city? Or are the peaks getting higher and the valleys deeper? Tracking these trends is more than just counting visitors. It’s about understanding the city’s new rhythm.
Peak season demographic composition
The crowd in Vegas during peak season is like a tech conference in Silicon Valley. It’s filled with specific talent, capital, and goals. This mix creates a unique ecosystem. It’s a big change for the gaming industry demographics.
Who visits when hotel prices go up and the Strip is crowded? The serious gambler is there, yes. But they’re joined by other groups. Imagine CES or a big fight weekend. The atmosphere is electric.
Convention attendees are there for deals, not just games. Ultra-wealthy people look for exclusive parties and celebrity dinners. Festival-goers add their own unique energy. This group is diverse and often chaotic.
Resorts now act like Swiss Army knives to serve all these groups. Video slots with different themes attract many visitors. During peak times, this strategy works best. Machines with music festival or luxury car themes sit next to each other. It’s a real-time example of demographic segmentation.
So, what does this mix look like in practice? The table below shows the main groups that make up the modern peak season crowd.
| Demographic Tribe | Primary Motivation | Estimated Daily Spend | Key Characteristic |
|---|---|---|---|
| Convention Delegate | Networking & Business | $400 – $800 | Expense account comfort; high F&B spend. |
| Ultra-Wealthy Experience Seeker | Exclusivity & Social Status | $2,500+ | Books high-limit tables, VIP nightlife tables. |
| Festival/Event Goer | Entertainment & Community | $300 – $600 | Lower gaming budget, high merch/experience spend. |
| The Legacy High Roller | Gaming & Comps | $1,000 – $5,000+ | Focus on table games; driven by host relationships. |
The visitor demographics change is clear. Peak season is now a mix of different lifestyles. Each group spends and uses space differently. For the gaming industry, success means understanding and serving this diverse crowd.
Off-season visitor characteristics
The off-season visitor is the smart one in Vegas. They love the blackjack table without the crowd. They enjoy steakhouse reservations at a normal time.
These visitors are often retirees and gamblers who value their money. They plan their trips carefully, unlike those who spend impulsively. They didn’t leave when travel got hard.
Casinos use smart systems to attract these visitors. They offer personalized upgrades and special deals. This helps them make money even when it’s quiet.
So, why do these visitors come? They want the real Vegas experience without the crowds. They see the city’s true appeal, beyond the hype.
The story of Las Vegas’ recovery is more than just numbers. It’s about the quiet moments, like a Tuesday in February. These visitors show that some things in Vegas never change.