
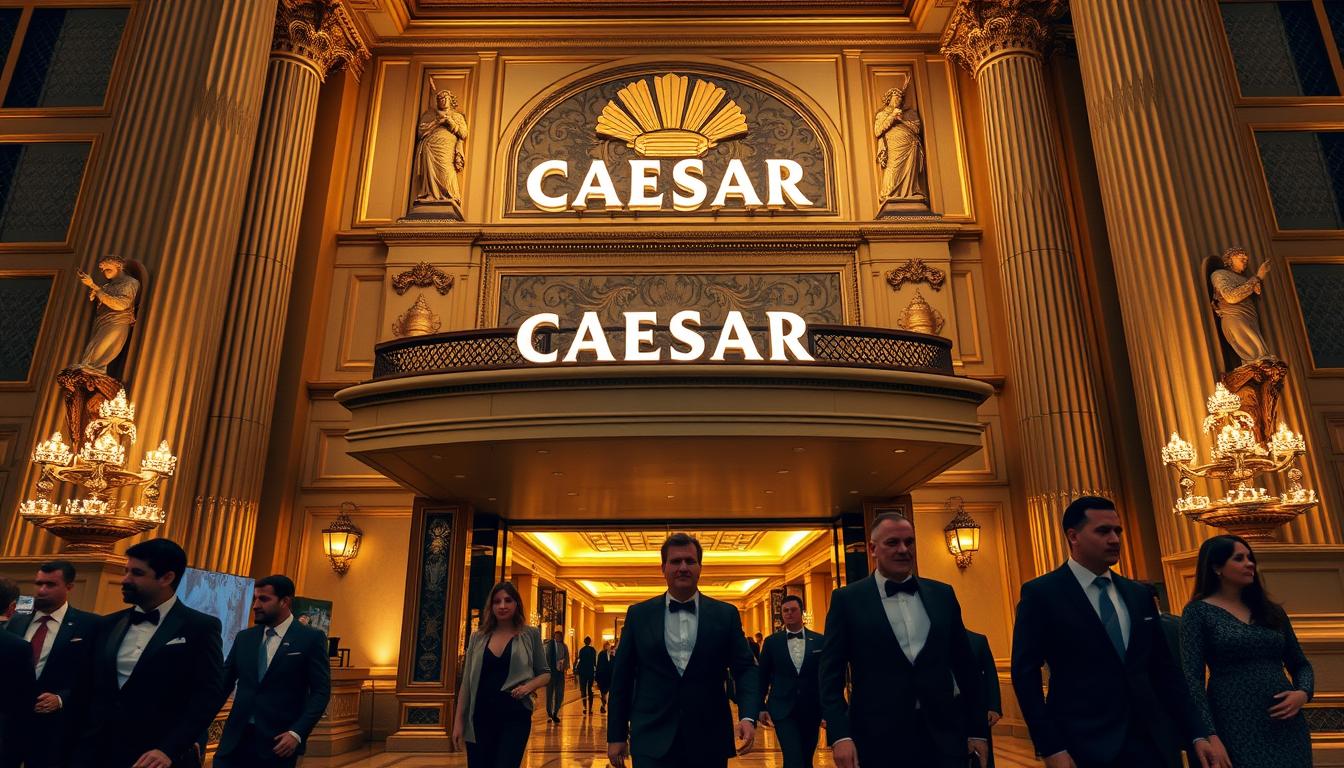
What happens when the house stops winning? Caesars Entertainment just lost a quarter of its value. This drop is as steep as the numbers seen during the pandemic.
CEO Tom Reeg shared the harsh truth: Vegas is less busy. Room rates have dropped over 6%, and occupancy is down 5%. It’s not just bad luck. It’s a big change in how Americans play.
The company runs a “hospitality hedge fund” – a smart mix of services for all. From high rollers to millennials, they cater to everyone. At Caesars Palace, some dream of the Rat Pack, while others look for deals.
But, when your main spot faces trouble, is it worth keeping up the brand ladder? This caesars case study shows the clash of luxury and reality.
Property Highlights: Caesars Palace, Paris, Planet Hollywood, Flamingo, Harrah’s
Imagine five different personalities under one roof. Caesars Palace is the clear leader, with its marble columns and grand ambition. It’s not just a hotel; it’s a Roman monument in the Nevada desert.
Paris brings the charm of the City of Lights to the Strip. The half-scale Eiffel Tower offers better views than the real one. And you can enjoy croissants with your blackjack. It’s a mix of European elegance and American ease.
Planet Hollywood is for those who love celebrities. You can play at tables once used by B-list stars. It’s a place where TMZ news is considered cultural enrichment.
Flamingo offers great value. It lets you feel fancy without spending too much. The flamingo habitat is as colorful as the guests.
Harrah’s is the dependable choice. It has no pretenses and offers consistent service. It’s like the comfort food of casinos, in a world of fancy themes.
| Property | Target Audience | Price Positioning | Unique Selling Point |
|---|---|---|---|
| Caesars Palace | High rollers | Premium luxury | Imperial Roman theme |
| Paris | Romantic getaways | Upper mid-scale | French architecture |
| Planet Hollywood | Younger demographic | Mid-scale | Celebrity connection |
| Flamingo | Value seekers | Budget-friendly | Historic reputation |
| Harrah’s | Traditional gamblers | Mid-scale | No-frills reliability |
Caesars’ diverse portfolio should be its strength. But in tough times, these different brands start to compete. Luxury spots feel the pinch first, while budget options face new challenges.
Keeping five brands alive while being one company is tough. It’s like trying to run an orchestra where everyone plays a different tune.
Rooms & Pricing Power by Tier
Welcome to the hotel pricing thunderdome, where every room category fights for survival. The Strip’s summer numbers show a big drop in room rates and occupancy. It’s like watching a high-stakes poker game where everyone’s bluffing with empty hands.
Caesars’ pricing power isn’t just about fancy linens and cocktail hours anymore. It’s become a financial tightrope walk over $11.9 billion in debt. When the Federal Reserve plays hardball with interest rates, that debt load becomes the uninvited guest in every hotel room.
Luxury Tier Pricing Dynamics
Remember when Caesars’ luxury properties could charge whatever they wanted? Those $600 rooms that sold out during conventions now sit emptier than a politician’s promises. The luxury tier’s pricing power has evaporated faster than a complimentary cocktail at a shareholders meeting.
What happened? The same thing that always happens when you assume your customers have unlimited budgets. Convention business softened. High rollers found new playgrounds. And that magical pricing authority? It vanished like a magician’s rabbit that decided not to come back.
The real tragedy? These properties have marble bathrooms and celebrity chef restaurants. They just forgot that luxury without demand is just expensive emptiness.
Mid-Tier Value Proposition
Welcome to the middle child of Caesars’ hotel family – constantly trying to get attention through creative discounting. The mid-tier properties are engaged in a price war with themselves, giving people “resort credits” that basically amount to giving people their own money back.
It’s financial jiujitsu: lower the room rate but add a “credit” that makes the number look better on paper. The problem? Customers aren’t stupid. They know when they’re being sold the same dollar for ninety-five cents.
The value proposition here should be straightforward: decent rooms at fair prices. Instead, it’s become a mathematical puzzle where everyone loses except the accountants who get to show “higher” rates on paper.
Economy Segment Challenges
If the luxury tier has pricing problems, the economy segment has pricing catastrophes. These properties aren’t just competing with other hotels anymore. They’re fighting Airbnb hosts who don’t have $11.9 billion in debt to service.
Think about that for a second: your competition is someone’s spare bedroom that comes with homemade muffins and zero corporate debt. How do you compete with that? You can’t on price. You can’t on charm. You can’t on flexibility.
The economy segment’s challenge is existential. It’s not about lowering rates – it’s about finding a reason to exist when your competitive advantage evaporated faster than you can say “interest rate hike.”
The brutal truth? Caesars’ room pricing across all tiers has become less about hospitality economics and more about debt service mathematics. When your pricing power is determined by Jerome Powell’s mood, you’re not in the hotel business anymore. You’re in the interest rate prediction business.
Gaming Mix & Table Strategy
Caesars’ casino floors are like a ballet, with every step aimed at making money. The mix of slot machines and table games is key. It’s a balance between steady income from slots and the ups and downs of table games.
It’s like a high-stakes game of chess. Every decision is huge, and the goal is to make the most money. How does Caesars keep the game exciting and profitable?

Slot Machine Economics
Slots are the steady earners in casinos. They make up 65-80% of the space and are very reliable. This is why they’re so important.
The math behind slot machine economics is simple yet effective. Machines have hold percentages that range from 6-15%. This means they keep a certain percentage of money played.
High-traffic areas have machines with tighter holds to keep players longer. Premium areas have high-limit slots for serious players. The design aims to keep players playing more.
High Roller Table Game Allocation
High roller table games are the big bets in casinos. They need a lot of space but can pay off big when the right players come.
Caesars has special areas for these games with high minimum bets. The goal is to make high-net-worth players feel special and encourage big bets.
For the very rich, there are private salons with even higher minimums. These places have lower house edges but make up for it with big bets.
Casino Floor Optimization
The art of casino floor optimization is all about balancing different types of games. It’s a science that uses data to make decisions.
Some key strategies include:
- Putting high-denomination slots near table games to attract players
- Designing paths to lead players to high-revenue areas
- Changing game mixes based on player data and results
- Adjusting table game prices during busy times
The goal is to make as much money as possible while keeping players happy. It’s a constant effort that combines art, science, and instinct.
Caesars Rewards Flywheel & Marketing ROI
The casino industry’s relationship with loyalty programs is complicated. Caesars Rewards is like a dating app where everyone wants points but runs away when it’s time to pay. It’s a test of whether people really believe in loyalty anymore.
Today, people are careful with their money. They might chase status in loyalty programs, but they stop when prices go up. This shows how hard it is to keep people loyal when money is tight.
Loyalty Program Architecture
Caesars Rewards has a fancy structure with seven levels, from Gold to Diamond Elite. It looks great, but it’s not as solid as it seems. Customers know the program is designed to make the casino win in the end.
Members earn credits in many ways:
- Slot play and table game wagers
- Hotel stays and resort spending
- Dining and entertainment purchases
- Partner brand transactions
The program’s strength is its ability to work across different locations. You can earn points in Las Vegas and use them in Atlantic City. But this big network is expensive to keep up.
Customer Lifetime Value Calculation
Figuring out the value of a customer in loyalty programs is hard. It’s like solving a Rubik’s Cube blindfolded. Customers often treat points like collectibles, not as a way to spend.
Caesars faces a tricky math problem:
| Customer Type | Points Behavior | Actual Value |
|---|---|---|
| Points Hoarders | Accumulate, rarely redeem | Low short-term ROI |
| Status Chasers | Spend to maintain tier | High but costly to maintain |
| Opportunistic Users | Only redeem during promotions | Unpredictable value |
The most valuable customers can be the most expensive to keep. Diamond Elite members want special perks like free upgrades. These perks eat into profits like a gambler counting cards.
Marketing Spend Efficiency
Marketing ROI in loyalty programs is a puzzle. Caesars spends a lot on personalized offers and digital campaigns. But they face tough competition and cautious consumers.
The math gets complicated when you think about:
- Customer acquisition costs have increased 27%
- Redemption rates change with the economy
- Personalized marketing costs a lot
- Competitors offer more to attract customers
When money is tight, marketing budgets often get cut. This is like taking away training wheels while riding a bike downhill. It’s risky.
The real test of marketing isn’t just getting people to visit. It’s getting them to visit and spend money. Sending offers to people who only want discounts is like throwing a party that nobody wants to pay for.
Renovation/Capex Updates and Expected Payback
Watching Caesars handle renovations is like watching a high-stakes poker game. The company has a huge $11.9 billion debt. This makes planning how to spend money very challenging.
Every dollar spent on updates is a gamble. Will new lobbies and suites attract today’s travelers? They might look for Instagram-worthy moments more than comfort.
Property Refresh Cycle
Caesars is always renovating. It’s like a never-ending home improvement project. They fix one room while another gets old.
Consider the property portfolio dynamics:
- Luxury properties need more frequent, expensive updates
- Mid-tier locations need smart, affordable refreshes
- Budget-friendly options get little changes
This cycle drains a lot of money. It’s hard to decide which property to update first.
Capital Allocation Priorities
Deciding where to spend money is tough. Caesars has to choose which properties to invest in.
They consider:
- Properties that make the most money per square foot
- Places where they face strong competition
- Assets that can raise prices after updates
- Properties needing cosmetic changes over big fixes
It’s like betting with casino chips. Every bet must win quickly.
ROI Timeline Projections
The ROI for these renovations keeps analysts up at night. The company hopes for the best – rate increases stick, competitors don’t renovate, and travelers value upgrades.
Here’s how they project timelines:
| Renovation Type | Investment Range | Target Payback Period | Key Success Metrics |
|---|---|---|---|
| Room Refreshes | $5-15M per property | 18-24 months | 15-20% rate increase |
| Common Area Updates | $10-25M per property | 24-36 months | Increased foot traffic, longer stays |
| Gaming Floor Updates | $15-40M per property | 12-18 months | Higher slot utilization, table game revenue |
These plans are based on the best-case scenarios. The market is very unpredictable. The success of these renovations depends on customers noticing and valuing the changes.
The real question is if these renovations will bring in enough returns. It’s like hoping your home renovation increases its value more than you spent on it.
Balance Sheet Context & Investment Flexibility
The $11.9 billion debt is like trying to win at blackjack with the house always raising the stakes. Federal Reserve policies have made this debt a big challenge. Every move needs to consider interest costs before thinking about returns.

Debt Structure Overview
Caesars’ debt is like a high-stakes poker game. The $11.9 billion liability is more than just money. It’s a complex mix of maturities, interest rates, and covenants that guides decisions.
Debt servicing costs are like a tax on every plan. Want to renovate? Check the debt service first. Thinking of expanding? The lenders get a big share of profits.
| Debt Component | Amount (Billions) | Interest Impact | Maturity Timeline |
|---|---|---|---|
| Senior Notes | $6.2 | High Sensitivity | 2025-2029 |
| Term Loans | $3.1 | Variable Rates | 2024-2027 |
| Convertible Notes | $1.4 | Fixed Rate | 2026-2028 |
| Other Liabilities | $1.2 | Mixed Impact | Ongoing |
Liquidity Position Analysis
The company’s cash is like a gambler who’s spent their winnings but needs to pay the hotel bill. Liquidity must balance between needs and debt, a tightrope walk with big risks.
Even strong quarters are quickly used for interest payments. It’s like winning a jackpot, only to find the IRS waiting.
Strategic Investment Capacity
Investment flexibility is key. It’s not what Caesars wants to do, but what the balance sheet allows. The difference is in the capital left after debt service.
Growth plans face tough financial checks. Every dollar for expansion is weighed against debt and interest.
The company’s investment capacity is like a high-limit table with rising stakes. While others play with their own money, Caesars plays with borrowed chips. The lender watches every move.
Competitive Position vs MGM & V/P
Watching Caesars compete in Las Vegas is like seeing two chess masters play at the same time. Newcomers keep changing the rules, but the main moves stay the same.
Market Share Comparison
Caesars and MGM are like twin titans on the Strip. But their market shares tell different stories. Caesars has more properties, while MGM offers a premium experience. The numbers show a surprising stalemate:
| Metric | Caesars | MGM | Las Vegas Sands |
|---|---|---|---|
| Strip Properties | 8 | 7 | 2 |
| Premium Room % | 35% | 52% | 68% |
| Table Game Yield | $1,250 | $1,480 | $1,650 |
| Loyalty Members | 65M | 42M | 28M |
The table shows Caesars’ volume advantage versus MGM’s premium positioning. Las Vegas Sands operates fewer properties but extracts more value from each guest. It’s the difference between a bustling family restaurant and an exclusive supper club.
Differentiation Strategy Assessment
Caesars’ differentiation strategy feels like trying to be the Swiss Army knife of casinos. They’re good at many things but master of none. Their approach leans heavily on geographic density instead of unique experiences.
MGM plays the premium card with precision. Their properties offer curated experiences, not just gambling. Venetian and Palazzo under Las Vegas Sands take it further, creating worlds where guests might never leave.
Caesars’ response? More mid-tier properties, more restaurant options, more everything. It’s the Walmart strategy applied to casino resorts – overwhelming selection instead of curated excellence.
Competitive Response Patterns
The competitive response patterns between these giants resemble a choreographed dance. Nobody wants to lead. When MGM raises room rates, Caesars follows a week later. When Caesars offers double loyalty points, MGM matches within days.
This creates a market dynamic where innovation happens at the edges. The real competitive threats come from:
- Boutique properties targeting specific demographics
- Non-gaming experiences drawing younger crowds
- Digital platforms capturing the home gambler
Both companies seem locked in a reactive pattern, like two heavyweight boxers circling each other. They wait for the other to throw the first punch while lighter, faster competitors score points around them.
The pricing strategy is fascinating. Caesars uses volume discounts, while MGM employs premium pricing. Yet both achieve similar overall revenue per square foot – different paths to the same destination.
In the end, the competitive position of each player reflects their historical roots. Caesars built through acquisition, MGM through development, and Sands through luxury focus. Their differentiation strategy emerges from these origins, not from any conscious market analysis.
12-Month Forecast & Sensitivity Analysis
Trying to guess Caesars’ next year is like guessing which Kardashian will be in the news. It’s coming, but the details are always a surprise. The company’s success depends on many things that are hard to predict.
Management is hopeful about conventions coming back. But, it’s like betting on a three-legged horse in the Kentucky Derby. It might win, but you shouldn’t bet your house on it.
Base Case Projections
Our base case is that the world doesn’t go completely crazy. Conventions will be back to 2019 levels by mid-2025. People will remember that gambling is more fun than TikTok. Interest rates will stay steady.
The math looks good:
| Metric | Q1 2025 | Q2 2025 | Q3 2025 | Q4 2025 |
|---|---|---|---|---|
| Revenue Growth | 4.2% | 6.8% | 8.1% | 7.3% |
| EBITDA Margin | 28.5% | 29.8% | 31.2% | 30.6% |
| Convention Attendance | 85% of 2019 | 92% of 2019 | 98% of 2019 | 102% of 2019 |
| Slot Handle Growth | 3.1% | 5.4% | 6.7% | 5.9% |
This scenario needs people to love networking events and free drinks again. It also assumes inflation stays low, like a relative who leaves early.
Downside Scenario Modeling
Now, let’s look at the worst-case scenario. Imagine remote work stays forever, and conventions turn into Zoom meetings. People might choose to spend their money on avocado toast and student loans instead of gambling.
In this world, Jerome Powell keeps rates high, making mortgages expensive. Millennials might find casinos as uncool as Facebook. Travel policies will be stricter than a Catholic school principal.
The scary thing? This scenario isn’t just a fantasy. We’re seeing it in how people spend their money.
Key Variable Sensitivity
Caesars is very sensitive to outside factors, more than Tesla stock. The main things that affect it include:
- Fed policy: Every 0.25% rate change impacts financing costs by $15-20 million annually
- Convention recovery: Each 10% drop in attendance reduces EBITDA by approximately $45 million
- Consumer confidence: A 5-point drop in confidence indices correlates with 3-4% lower gaming revenue
- Labor costs: Wage inflation above 4% creates significant margin pressure
The most sensitive factor? Consumer discretionary spending. When people spend less, gambling is often the first thing to get cut.
What keeps management up at night? The fear that their best-case scenario needs everything to go right. But, their worst-case scenario only needs one thing to go wrong.
Strategic Watch List for Analysts
Analysts tracking Caesars Entertainment have a thrilling task ahead. It’s not just about numbers. They must keep an eye on debt and interest rates.
Key Performance Indicators
Keep a close eye on visitation trends and room rates. Occupancy numbers are one thing, but debt levels tell another story. Interest rates can make or break earnings calls.
Management Execution Tracking
Is management showing strategic clarity or just making changes for the sake of it? Smart investments in properties are key. The line between vision and vanity is thin.
External Factor Monitoring
Fed meeting minutes are essential reading. Airline capacity plans affect visitor numbers. Las Vegas tourism surveys are like crystal balls. Convention bookings can disappear or materialize.
The big question is: Can Caesars become a unified ecosystem? Right now, they’re not just competing with MGM. They’re fighting to stay relevant.


