

Ever wonder what makes Las Vegas different from Atlantic City? We’re diving deep into these two gambling hotspots.
I’ve spent a lot of time in academic journals. We’re talking about UNLV gaming research from 1995-2011. Plus, macroeconomic studies and regression models galore.
This isn’t just about collecting data. It’s a detailed look at American gambling culture. We’ve looked at quarterly numbers from 1990-2009 and 22 studies. We want to know what makes these places special.
The findings might shock you. Let’s see how these famous gaming spots compare.
Visitor Demographics & Trip Purpose
Let’s play a quick game of geographic association. When I say “Atlantic City,” what comes to mind? For most, it’s a day trip destination – the kind of place you hit when you need a quick escape from Philadelphia or New York. Now say “Las Vegas” and suddenly we’re talking cross-country flights, week-long itineraries, and that special kind of vacation excitement that requires months of planning.
The data confirms what our gut already knows. Hunsaker’s 2001 research shows Atlantic City visitors come from within a 150-mile radius, traveling by car or bus. Vegas? That’s a national draw with significantly higher travel costs. It’s the difference between grabbing a slice of pizza and booking a Michelin-star restaurant months in advance.
Shonkwiler’s 1993 findings add another layer to this story: when Atlantic City casinos opened, Vegas saw a 43.8% drop in Eastern visitors. Why fly across the country when you can drive a couple hours? This demographic divide explains everything from average length of stay to spending patterns.
The Atlantic City crowd represents disposable income with limited time. They’re day-trippers making impulse decisions. Vegas attracts vacationers with both disposable time and frankly, more disposable income. This fundamental difference in visitor psychology creates entirely different economic models for these two gaming meccas.
Consider the ADR implications: Atlantic City’s regional draw means shorter stays and lower room rates, while Vegas’ destination status supports premium pricing and longer bookings. The trip purpose dictates the spending behavior – and the ADR reflects that reality perfectly.
So what does this mean for casino operators? Everything. Marketing strategies, loyalty programs, even slot machine denominations – all shaped by whether your average customer drove three hours or flew across three time zones. It’s not just different markets; it’s different universes of consumer behavior.
Gaming KPIs: Where Slot Win Meets Table Revenue Reality
If casinos were rock bands, slots would be the pop act filling stadiums. Table games would be the jazz ensemble that truly understands music. Both make money, but in very different ways.
Slot Win Performance Metrics
Slot machines are the hardworking heroes of casino revenue. Nichols’ 1998 research showed a big jump in gaming win when Atlantic City added more slots. It was like a gambler hitting three sevens.
Thalheimer and Ali’s 2008 study found a clear link between slot win and more machines and hours. More machines and hours mean more money. It’s simple math even a slot player can grasp.
But slots are all about volume. They’re like Walmart in gambling, attracting lots of people but making less money. The slot win percentage might look good, but it needs a lot of space and constant play.
Now, let’s talk about table games. They’re where the real magic happens, with high-roller action that makes executives happy. While slots attract the masses, tables attract the class.
The table revenue story is unique. It’s about psychology and building player relationships, not just space. When table games hit right, it’s pure profit poetry.
Vegas knows how to balance table revenue better than Atlantic City. They focus on high-limit rooms and player relationships, not just filling space. It’s like the difference between fast food and a Michelin-star meal.
Atlantic City relies too much on slot win, making it vulnerable to economic changes and demographic shifts. Tables, on the other hand, are the steady income that keeps casinos going when slot volume drops.
Rooms & Pricing Power: ADR/RevPAR comparison
Vegas hotels charge like Taylor Swift concert tickets. Atlantic City hotels offer rooms like last-minute deals on Groupon. The main difference is in their business approach. Vegas focuses on experiences, while Atlantic City aims to sell rooms.
Flanegin’s study shows a key difference: Vegas is a destination for long stays. Atlantic City is for quick weekend getaways. This affects pricing, making Vegas a big win or a big loss for revenue managers.
Average Daily Rate Competitive Analysis
Vegas ADR is in a league of its own. Expect to pay $300-500 per night during peak times. The Strip’s pricing assumes visitors are ready to spend big before they even arrive.
Atlantic City’s ADR is less impressive. Rates vary from $100-200, with weekend prices that drop fast. Their pricing is more reactive than proactive.
Vegas hotels offer a complete experience for the high price. Atlantic City views rooms as a basic need, not a luxury.
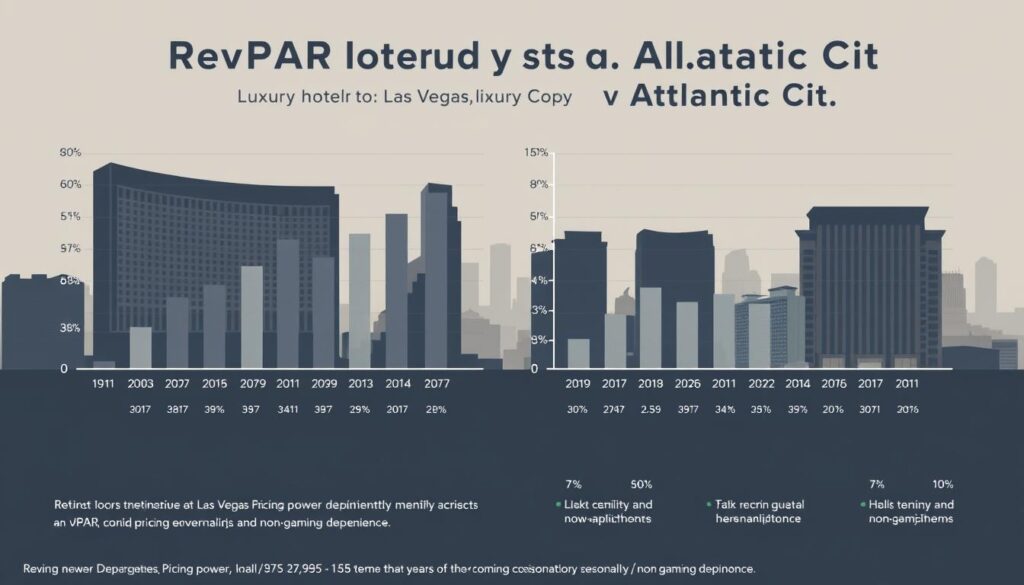
RevPAR shows the stark contrast between Vegas and Atlantic City. Vegas consistently scores high, with RevPAR around $200-350. Atlantic City’s RevPAR rarely tops $150, even on summer weekends.
The length of stay greatly affects these numbers. Vegas guests stay 3-4 nights, allowing for higher rates. Atlantic City’s guests stay 1-2 nights, keeping prices low.
| Metric | Las Vegas Average | Atlantic City Average | Premium Difference |
|---|---|---|---|
| Weekday ADR | $325 | $115 | 182% higher |
| Weekend ADR | $475 | $185 | 157% higher |
| Annual RevPAR | $287 | $132 | 117% higher |
| Occupancy Rate | 92% | 78% | 14% points higher |
Seasonality & Weather Effects
If casinos ran weather forecasts, Atlantic City would need a storm warning system while Vegas would just check what conferences are in town. The seasonal rhythms of these two gaming meccas couldn’t be more different – one dances to nature’s tune, the other writes its own music.
Research by Flanegin and others proves what any blackjack dealer could tell you: seasonal variables significantly impact casino revenues. Their analysis of quarterly data from 1990-2009 shows that seasonality isn’t just a factor – it’s the house advantage in some markets.
Quarterly Performance Fluctuations
Vegas experiences what I call “conference cushion” – those massive industry gatherings that fill hotels regardless of the calendar. Their quarterly performance looks like a smooth blackjack curve: consistent, predictable, and always in the game.
Atlantic City? Its quarterly chart looks like a slot machine payout history – massive peaks in summer, terrifying valleys in winter. It’s the difference between a diversified investment portfolio and putting all your chips on one number.
Nichols’ 1998 ARIMA models accounted for these trends perfectly. The numbers don’t lie: when your business depends on beach weather and drive-in traffic, you’re basically gambling on meteorology.
Meteorological Impact on Gaming Revenue
Here’s where it gets fascinating. Atlantic City’s proximity issues and transportation modes make it incredibly weather-sensitive. A rainy weekend? Revenues drop faster than a tourist’s slot machine budget.
Vegas could have a biblical flood and people would stil gamble – they’re already indoors! The desert climate and indoor-focused resort model create natural insulation against meteorological whims.
The data reveals an uncomfortable truth: some casinos are playing against weather house odds every day. While Vegas masters seasonal patterns, Atlantic City remains at Mother Nature’s mercy – and she never plays fair.
Non‑Gaming Mix & Profitability
Atlantic City focuses on chance, while Vegas aims to create lasting memories. This difference explains why one thrives and the other barely survives. Non-gaming revenue is key to modern casino success.
Lauve’s 2007 study showed that adding amenities is a must for staying competitive. Hunsaker’s 2001 research highlighted Vegas’s focus on leisure, unlike Atlantic City’s gaming focus. It’s like playing chess versus checkers.
Ancillary Revenue Streams Comparison
Vegas knew decades ago that experiences beyond gambling attract visitors. Shows, dining, and even people-watching became big money-makers. Atlantic City, on the other hand, struggles to show that gambling alone is worth the trip.
| Revenue Stream | Las Vegas Contribution | Atlantic City Contribution | Profit Margin Difference |
|---|---|---|---|
| Entertainment & Shows | 18-22% | 5-8% | +12-15% |
| Food & Beverage | 15-18% | 8-10% | +7-9% |
| Retail & Shopping | 12-15% | 3-5% | +9-11% |
| Spa & Wellness | 8-10% | 2-3% | +6-8% |
| Convention & Meetings | 20-25% | 4-6% | +16-20% |
Vegas makes more money from non-gaming activities than Atlantic City does from gaming. The gap is huge. Vegas offers a wide range of options, not just gambling.
Profitability Beyond the Casino Floor
Profitability based on slot losses is shaky. But, profit from Cirque du Soleil and celebrity restaurants is solid. This shows a strong business model.
Non-gaming activities often have higher profit margins. They’re less regulated, grow faster, and attract more people. Families and non-gamblers help boost these earnings.
Investing in non-casino activities creates stable income. It’s about selling experiences, not just addiction. This approach makes a big difference.
Marketing & Loyalty Program Differences
If casino marketing were high school, Vegas would be the popular kid with designer clothes. Atlantic City would be the one trying to buy friends with free pizza. It’s not just about money—it’s about how they think.

Vegas markets like a luxury car brand—selling the experience and status. Atlantic City is more like a late-night infomercial, always adding more. This shows how they think differently about money and customers.
Player Development Strategies
Vegas builds relationships, while Atlantic City focuses on transactions. I’ve seen this for years. Vegas wants to create unforgettable moments. Atlantic City aims for quick rewards.
Research shows interesting reasons behind this. Destination resorts aim for memorable experiences. Regional casinos focus on quick wins and easy access.
Comp Program Effectiveness Analysis
Lauve’s 2007 study found something surprising. The number of people getting comps is more important than the amount given. It’s about giving to many, not just giving a lot.
Nichols’ 1998 study added more insight. Comps can make gaming win numbers look better than they are. It’s like using filters on dating app photos.
The comp game shows how different Vegas and Atlantic City are. Vegas offers perks to enhance the experience. Atlantic City gives perks to keep players coming back.
This difference in player development strategies shapes their business models. Vegas focuses on loyalty that lasts. Atlantic City aims for quick wins with every new offer.
Regulatory & Tax Comparisons
Gaming regulations are like a poker game, with Nevada as the dealer and New Jersey playing blind. The rules aren’t just about paperwork. They reflect different views on how casinos should run.
One state sees gaming as its top treasure. The other views it as a tricky relative at Thanksgiving.
Gaming Regulation Impact Analysis
Smoking bans are a big deal. Studies by Thalheimer and Ali show they can cut coin-in by 12.7-17.8%. Pakko’s study found gaming win drops of 8.6-15.8%.
This isn’t a small issue. It’s a matter of survival for some casinos.
Nichols’ research on operating hours and slot space shows another side. Some states control casino floors too much. Others trust casino owners to manage well.
The impact of regulations goes beyond obvious rules. It’s about:
- License approval timelines (months vs years)
- Game approval processes (flexible vs rigid)
- Marketing restrictions (creative vs constrained)
- Customer data usage (strategic vs limited)
These differences shape environments that either encourage innovation or hold it back.
Tax Structure Competitive Disadvantages
Taxes are a silent killer of casino profits. The tax structure between markets is so different, it’s like cheating at Monopoly.
Here’s a comparison of key tax and regulatory factors:
| Factor | Nevada Approach | New Jersey Approach | Competitive Impact |
|---|---|---|---|
| Gaming Tax Rate | 6.75% | 8% + 1.25% investment alternative | 15-20% higher effective rate |
| Smoking Regulations | Limited restrictions | Complete indoor ban | 12-18% revenue impact |
| License Fees | Scaled to revenue | Fixed high minimums | Barrier to entry |
| Operating Hours | 24/7 flexibility | Limited hours | 15-25% capacity utilization difference |
| Promotional Credits | Full tax deduction | Limited deductions | Marketing efficiency gap |
These differences are huge. A 2% tax difference might seem small, but on billion-dollar revenues, it’s huge.
The smoking ban alone creates a huge revenue gap. Without comfortable customers, you’re just trying to survive.
Regulatory environments either help or hurt. One approach boosts gaming revenues. The other just adds to bureaucratic headaches.
12‑Month Outlook for Both Markets
Predicting casino markets is tough. We’d all be rich in Monaco if it were easy. Gaming revenues recover slowly, taking 12-18 months, says Flanegin’s research. It’s like watching a sequel where you know the ending but hope for a twist.
Las Vegas and Atlantic City are different markets. Vegas thrives on prosperity and celebration. Atlantic City survives on convenience and desperation. The next year will show which one is more resilient.
Short-Term Projections and Trends
Vegas is expected to have a “K-shaped recovery”. Luxury properties will soar, while value properties struggle. Convention business is slowly coming back, but international travel is unpredictable.
Atlantic City faces tough competition from nearby states. Pennsylvania, New York, and Delaware casinos have taken billions. AC’s value proposition is shrinking every day.
The numbers show a tough past. In 2009, Vegas/AC revenues fell below a billion. Now, the recovery is about reinventing what “back” means.
| Market Metric | Las Vegas Projection | Atlantic City Projection | Competitive Pressure Index |
|---|---|---|---|
| Q3 Revenue Growth | 8.2% | 2.1% | Medium/High |
| Convention Bookings | 74% of 2019 | N/A | Low |
| Regional Competition Impact | Minimal | Severe | High/Extreme |
| Premium Room Demand | Strong | Weak | Variable |
| 12-Month Outlook Score | 7.8/10 | 4.2/10 | N/A |
Recovery Timeline Expectations
Vegas is expected to reach 90% of pre-pandemic levels by Q2 next year. It’s fueled by pent-up demand and the American urge to celebrate. Vegas always comes back strong.
Atlantic City’s recovery looks flat. It might stabilize at 70-75% of previous levels. This becomes the new normal, not a temporary setback.
The real question is what they’ll recover to. Vegas will return to its former glory. Atlantic City might become more experiential, less gaming-focused. Evolution can hurt before it helps.
Watching convention bookings in Vegas and regional competition in AC is key. These will show the true recovery timeline. The rest is just noise and wishful thinking.
Key Takeaways for Investors
When comparing Las Vegas to Atlantic City, the numbers are striking. Vegas is booming, with 51.5 billion in out-of-wallet spend. Atlantic City, on the other hand, is struggling to stay afloat. The difference is clear.
Investment Risk Assessment
Investing in Vegas is like choosing a blue-chip stock. It has a mix of gaming, entertainment, and conventions, creating a strong economy. Atlantic City, mainly focused on gambling, faces structural issues. Vegas adapts to economic changes, while Atlantic City battles regional competition.
Portfolio Allocation Recommendations
For steady growth with low risk, Vegas properties are a top choice. They show consistent strength and innovation. Atlantic City investments should be small, for those who like turnaround stories. Choosing Vegas means picking a leader, while Atlantic City is a regional player facing challenges.
The smart money goes for diversification. Vegas is building an empire, not just playing cards.


