
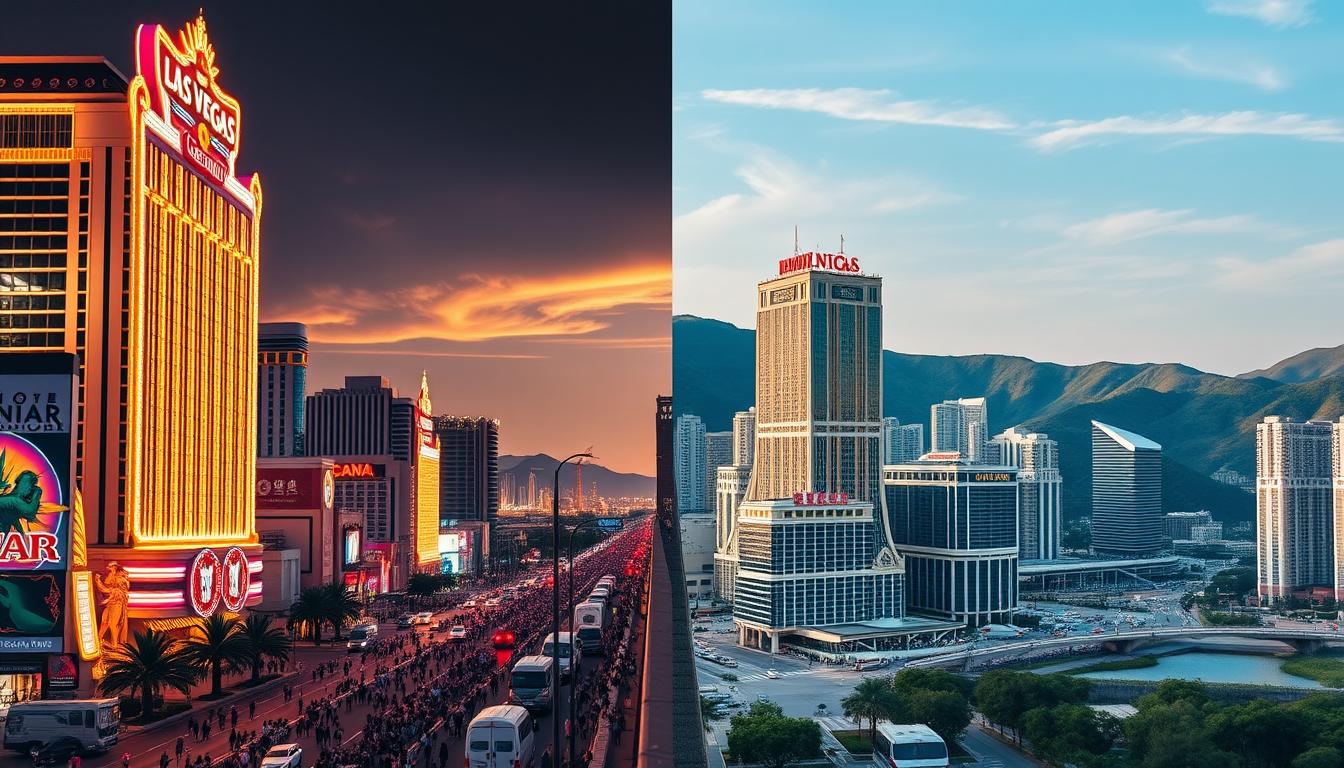
Comparing Las Vegas and Macau is like comparing The Beatles and The Rolling Stones. Both are legendary, but they have different business models and fan bases.
Why compare them? In the casino world, knowing the differences is key to survival. Las Vegas focuses on weekend getaways with shows and dining. Macau, on the other hand, is the top spot for high-roller gambling.
Macau’s 150% revenue jump contrasts with Las Vegas’s slow recovery. This shows two different worlds waking up. Knowing both is smart.
It’s not about who’s better. It’s about seeing how each place’s unique traits offer different risks and chances. The real question is, why wouldn’t you compare them?
Looking at GGR per visit metrics, we see interesting contrasts. These numbers show more than just money. They reveal customer habits, market readiness, and growth chances.
Comparable Metrics & Methodology
Ever tried comparing a Broadway show to a Beijing opera? That’s what we do when we compare Las Vegas Sands to competitors like Wynn, MGM, and Galaxy Entertainment. It’s not just about numbers. It’s about understanding different business worlds.
We look at three key metrics. EBITDA margins show how well a company runs (LVS is at 36%). RevPAR measures hotel success beyond just games. And gross gaming revenue per visitor shows how much money visitors spend.
The real story is in the VIP vs mass market split. Macau relies on high rollers, leading to ups and downs. Vegas focuses on the mass market, giving steadier profits. It’s like betting on one big fish versus many small ones.
Table density shows how well gaming spaces are used. It’s like retail’s sales per square foot, but with more excitement. Higher density often means better profits, but too much can be bad.
Smart analysis sees the difference between a Macau high roller’s dollar and a Vegas convention attendee’s dollar. LVS balances both markets well. This diversifies revenue and uses space efficiently.
The future of the industry is in online gaming and non-gaming attractions. But knowing these core metrics? That’s how you spot the smart investors from the tourists at the craps table.
Revenue Mix: VIP, mass tables, slots, non‑gaming
Imagine two parties – one’s a VIP lounge with $500 cocktails, the other’s a massive festival. That’s the revenue mix difference between Macau and Las Vegas.
Macau’s economy is mostly driven by high-rollers. In 2023, gaming made up 65% of their revenue. The rest is split between rooms, food & beverages, and other activities. It’s like a financial martini, mostly liquor with a hint of vermouth.
Now let’s benchmark Las Vegas vs Macau on diversification. Vegas makes money from many sources, not just gambling. Their revenue streams are like a well-balanced investment portfolio:
| Revenue Source | Las Vegas Typical % | Macau 2023 % | Strategic Advantage |
|---|---|---|---|
| Gaming & Gambling | 35-45% | 65% | Macau: Higher margin, Vegas: Lower volatility |
| Rooms | 20-25% | 15% | Vegas: Premium pricing power |
| Food & Beverage | 15-20% | 14% | Vegas: Celebrity chef ecosystem |
| Entertainment/Other | 15-25% | 6% | Vegas: Diversification buffer |
The regulatory climate shaped these different business models. Macau’s system focused on gaming, while Nevada encouraged innovation outside casinos. When China’s anti-corruption campaign hit Macau’s VIP segment, it was a big blow.
Vegas, on the other hand, built entire cities within their resorts. They have convention centers, nightclubs, and entertainment venues. Their MICE business helped them weather economic storms.
This isn’t just about different strategies – it’s about risk profiles. Macau plays high-stakes poker, while Vegas runs a diversified entertainment empire. Both approaches have their merits, and understanding this mix helps explain market responses to economic changes.
Volatility & Seasonality Patterns
Stock market charts look wild, but Macau’s revenue graphs during the pandemic years are even crazier. The numbers show a wild ride that makes even seasoned investors nervous.
From a huge drop to $2.94 billion in 2020 to a big jump to $10.37 billion in 2023, it’s a story of recovery. This V-shaped path shows how sensitive the market is.

The swings in revenue are due to the VIP vs mass mix. High rollers are like weather vanes, changing with every wind. Their spending creates big peaks and valleys.
On the other hand, mass market players are steady. They plan their gambling like vacations, less affected by outside factors. This difference in spending makes their impact on volatility different.
Looking at GGR per visit shows who’s really driving revenue. Is it one big spender or many tourists spending a bit? The answer shapes the chart’s ups and downs.
Seasonality adds more complexity. Think about:
- Chinese New Year versus Super Bowl weekend
- Golden Week versus CES convention crowds
- National holidays creating different Pacific rhythms
Macau’s recent 25.8% Q1 EBITDAR decline shows the pain of changing from VIP to mass. But it’s needed for long-term health.
The best operators understand these patterns like jazz musicians get time signatures. They know when to expect highs and lows. In this field, timing is everything.
Regulatory & Tax Structures
If casino regulations were dating apps, Macau would be the exclusive matchmaker with a six-person limit, while Vegas would be the wild west of swiping right. The regulatory climate in these gaming hubs couldn’t be more different if they tried.
Singapore operates what I call the “bouncer model” – only two operators get past the velvet rope. LVS enjoys this government-sanctioned duopoly, creating what economists politely call “barriers to entry” and what I call “the best business model.”
Macau takes the oligopoly approach with six concessionaires. It’s like a private club where the membership committee hasn’t accepted new applications in 20 years. This setup creates fantastic insulation from competition – the kind of protection that would make even Adam Smith raise an eyebrow.
Then there’s Nevada, the libertarian cousin who believes in free markets and relatively open licensing. Less protection, more competition. It’s the difference between playing chess with a grandmaster who occasionally changes rules versus playing poker with friends who make up rules as they go.
The tax man always gets his cut, but how he takes it varies dramatically. Macau’s government takes a significant portion but structures it to favor the house. Nevada’s system has evolved to accommodate diverse revenue streams beyond just gaming.
These regulations directly impact table density – how many games you can operate in your space. It’s the real estate game within the casino game. Macau’s recent concession renewals came with strings attached: more non-gaming investment requirements, closer government oversight. Vegas operators worry more about city ordinances than central government mandates.
The capital requirements alone would make most entrepreneurs weep. We’re talking billions, not millions. It’s why you see the same players at the table year after year – the buy-in is simply too high for newcomers.
So while Macau offers protection at the cost of flexibility, Vegas offers freedom at the cost of security. Different games, different rules, same high stakes.
Capacity & Table Allocation Policies
Ever watched a master sommelier arrange a wine cellar? That’s table allocation in the casino world – part science, part art, all strategy. The placement of each gaming table represents millions in possible revenue. Getting it wrong costs more than just floor space.
Take Macau’s giants like The Venetian and The Londoner. Their scale creates a network effect smaller competitors can’t match. They’re not just building casinos – they’re creating gravitational pulls for high rollers.
The table density calculation would make a Wall Street quant blush. Too few tables and you’re wasting premium real estate. Too many and you create a crowded environment that repels premium players. It’s the Goldilocks principle of casino floor planning.
Our benchmark Las Vegas vs Macau analysis reveals fascinating contrasts. Macau properties might dedicate 70% of their floor to baccarat – the game of choice for Asian high rollers. Vegas spreads tables across multiple games to appeal to diverse tourist demographics.
| Market | Primary Game Focus | VIP Room Revenue Share | Table Allocation Strategy |
|---|---|---|---|
| Macau | Baccarat (70%+) | 60-70% | High concentration, VIP-focused |
| Las Vegas | Diverse mix | 20-30% | Varied spread, mass market appeal |
| Singapore | Baccarat/Poker blend | 40-50% | Balanced approach |
VIP rooms tell the real story. They might represent only 20% of tables but generate 60% of revenue. That’s like a restaurant reserving its best tables for customers who arrive by private jet with seven-figure credit lines.
Classic table games – blackjack, roulette, poker, baccarat, craps – continue drawing high-stakes players. But their placement? That’s where casino math meets gallery curation. Each table’s position is a calculated bet on human behavior and profit.
The policies governing these decisions blend market demand, regulatory constraints, and operational strategy. It’s a constant optimization game where the house always wins – but only if they play their cards right.
Customer Acquisition & International Airlift
Finding high rollers in gaming is like Tinder for billionaires. Some operators use private jets, while others use airport billboards. The VIP vs mass game shows two different strategies.
Wynn’s $250-300 million investment in the Palace Event Center is more than just architecture. It’s a way to attract corporate clients. Their $450-500 million theater expansion is like a mass market charm offensive. Both aim to boost GGR per visit.
Macau’s airlift dependency is like a long-distance relationship. When mainland China flights are grounded, revenue drops. Vegas, on the other hand, has diverse feeder markets and competes with Nashville and Orlando for conventions.
The cost of acquiring VIPs is staggering. It includes private jets, personal concierges, and credit lines that go beyond banking. Mass acquisition focuses on airline partnerships, hotel packages, and free drinks.
Smart operators know when to send champagne or offer free drinks. This balance affects marketing budgets and casino floor layouts.
Success isn’t just about acquisition cost. It’s about lifetime value. Are you getting many small spenders or a few big whales? This question shapes business models and separates the smart from the desperate.
Margin Profiles & Cost Structures
Let’s dive into what really matters in the casino world. It’s not just about the big wins, but the numbers that count after everyone takes their share. The margin game between Vegas and Macau is like comparing different economic views.
Recent data shows a big jump in EBITDA margins, now over 36%. Operating margins are at 24%. These numbers show strong pricing and cost control.
The real money is made on the gaming floor, not fancy hotels or pricey drinks. VIP play, mass tables, and slots are where the profits are.
Macau’s regulatory climate is unique. Higher gaming taxes cut into revenue, but VIP play can make up for it. Vegas has lower taxes but faces more competition, squeezing margins.
Cost structures differ between Macau and Vegas. Macau’s labor costs are different from Vegas’s unionized workforce. The table density affects margins a lot. More tables mean more costs, but the right mix can be very profitable.
Non-gaming areas also play a role. Restaurants might break even to attract gamblers. Retail space is rented out at good margins. It’s a complex system where losses in one area can lead to profits in another.
| Margin Component | Macau Typical Range | Las Vegas Typical Range | Key Drivers |
|---|---|---|---|
| VIP Gaming | 35-45% | 25-35% | Commission structure, credit risk |
| Mass Market Tables | 40-50% | 30-40% | Table density, minimum bets |
| Slot Operations | 25-35% | 20-30% | Machine placement, denomination mix |
| Hotel Operations | 5-15% | 10-20% | Occupancy rates, room pricing |
| Food & Beverage | -5% to 5% | 0-10% | Premium pricing, volume |
Understanding these relationships is key for casino executives. It’s not just about making money. It’s about keeping it.
Scenario Outlook: Macau recovery vs LV events calendar
Welcome to the casino crystal ball – where future projections are more volatile than a slot machine’s payout cycle. The benchmark Las Vegas vs Macau recovery story isn’t just about numbers; it’s about two completely different philosophies of gambling resurrection.
Macau’s 150% revenue surge sounds spectacular until you realize it’s like celebrating a high score after resetting the game to beginner mode. The real question isn’t about recovery percentages but sustainability. Can Macau regain its pre-pandemic swagger, or has the market fundamentally transformed?
While Macau bets on Chinese high-rollers returning, Vegas stacks chips on its events calendar – CES, Super Bowl, March Madness, and countless conventions that may or may not materialize. It’s the difference between waiting for royalty to arrive versus hoping the entire middle class shows up with credit cards.
The contrast reveals fascinating risk profiles. Macau’s recovery hinges on three unpredictable factors:
- Chinese economic policy shifts
- Cross-border travel regulations
- Whether wealthy Chinese will gamble conspicuously
Vegas faces its own trilogy of uncertainties:
- American discretionary spending patterns
- Airline capacity and travel willingness
- Corporate convention budgets post-zoom era
The regulatory climate adds another layer of complexity. Macau’s government pushes for more non-gaming investment, while Vegas regulators wrestle with problem gambling concerns and sports betting competition. It’s like watching two patients recover from the same illness using completely different treatments with different side effects.
Wynn’s $5.1 billion bet on Al Marjan Island represents the ultimate hedge – a third option beyond the Macau-Vegas dichotomy. Because why choose between two recovery models when you can invent a new one entirely?
| Recovery Driver | Macau Strategy | Las Vegas Approach | Risk Factor |
|---|---|---|---|
| Primary Revenue Source | VIP Gambling Return | Events & Conventions | High vs Medium |
| Regulatory Dependency | Chinese Policy Shifts | US Spending Patterns | Extreme vs Moderate |
| Growth Timeline | Gradual Return | Event-Driven Peaks | Unpredictable vs Cyclical |
| Market Diversification | Non-Gaming Push | Sports Betting Integration | Experimental vs Evolutionary |
So which recovery story wins? The answer might be “both” or “neither” depending on which week you ask. Macau offers spectacular upside with regulatory strings attached. Vegas provides steadier growth with American consumer whims.
The smart money isn’t betting on one horse but understanding how these two recovery models will redefine global gaming landscapes. Because in this high-stakes game, the house always wins – but which house remains the real question.
Strategic Implications for Strip Operators
So, what’s the play for Vegas heavyweights after this global casino tour? The answer lies in balancing act—like a high-stakes game of blackjack where both VIP vs mass matter. Operators can’t afford to put all their chips on one bet.
Take a cue from LVS. Their deep moat isn’t just luck; it’s built on scale and smarts. Or Wynn, playing the premium card with cost discipline and eyeing new frontiers like the UAE. Table density isn’t just about squeezing in more seats—it’s a signal. Who do you want in your house?
Diversification saved many during lockdowns. MGM’s US spread, Vegas’ non-gaming gems—they weren’t just extras; they were lifelines. The smart move? Blend Macau’s lessons with Vegas’ flair. Add amenities, refine experiences, and maybe even dabble in digital or sports betting.
In the end, it’s not about copying the neighbor’s homework. It’s about learning why they aced the test—and writing your own rules. Because in this game, the house always wins, but the sharpest operators? They win bigger.


