Forget about lucky charms like rabbit’s feet and four-leaf clovers. In the casino world, monthly revenue reports are the real crystal ball. When COVID hit, Sin City became Ghost Town USA, with visitation down 55% and earnings plummeting to 1998 levels. Suddenly, everyone was obsessed with weekly slot machine receipts.
Quarterly summaries are like watching poker through smoked glass. The HVS 2021 report showed Clark County’s $6.5B collapse didn’t happen in three-month chunks. It was a daily grind of empty rooms and craps tables. We’re not just looking at spreadsheets; we’re examining the Strip’s financial pulse.
Why does this matter now? 2023’s numbers are hitting hard, like a Blackjack dealer’s hot streak. But here’s the kicker: quarterly revenue analysis for casinos is like counting cards. Miss the subtle shifts between February and March, and you’re betting blind. Those “minor” monthly dips? They’re the difference between winning big and folding your hand.
This isn’t just number-crunching. It’s survival math for an industry where yesterday’s jackpot becomes tomorrow’s restructuring plan. Want to predict the next big win? Start looking between the lines – and the weeks.
How Data is Collected and Reported
Ever feel like the blackjack table blinks when you hit 21? It’s not just your third whiskey sour talking. Las Vegas casinos have a real-life Panopticon. They use IoT sensors, RFID chips, and facial recognition to track your every move. They watch and calculate your every bet.
The Surveillance State (That Pays Your Jackpot)
Modern slot machines are like undercover accountants. Each spin sends 15+ data points to the Nevada Gaming Control Board (NGCB). This includes:
- Coin-in/coin-out ratios (because even your losing streaks are taxable)
- Time between bets (they know when you’re chasing losses)
- Jackpot triggers (those “service needed” lights? More like “taxman alerted” signals)
From Slot Sensors to Tax Forms
In 2020, Vegas visitors gambled $344 daily, a 41% spike from before. Here’s how that money is broken down before it reaches the state:
| Data Source | What’s Tracked | Tax Implications |
|---|---|---|
| Slot Machines | Every spin, win percentage, machine occupancy | 6.75% state tax on gross revenue |
| Table Games | Average bet size, player duration, dealer speed | Live monitoring for license compliance |
| Player Cards | Total spend across properties, comps used | Audit trail for revenue allocation |
This isn’t just Big Brother. It’s Big Bookkeeper. The NGCB’s 15+ machine reporting rule means even that dusty Wheel of Fortune slot near the bathroom contributes to Las Vegas casino operator revenue reports. Your bad luck? Their balanced ledger.
Breakdown by Year: 2022–2024
Las Vegas bounced back from the pandemic like a dealer shuffling cards. The Strip and Downtown recovered at different rates. Let’s look at what made them different.

The Hangover After COVID’s Lost Weekend
2020 was tough on Nevada casinos, like a rookie betting against the house. The Strip’s revenue fell 36.8%, losing 17,000 high roller baccarat sessions daily. Downtown did better, with a 29.3% drop, showing locals’ love for $5 blackjack.
In 2021, capacity limits were strict. The Strip focused on big spenders, while Downtown became a secret spot. This led to a $7 billion revenue rebound, but unevenly spread.
Strip vs Downtown: Recovery Speed Differences
Here’s where the Strip and Downtown differed:
| Metric | Las Vegas Strip | Downtown |
|---|---|---|
| 2020 Revenue Drop | 36.8% | 29.3% |
| Return to Pre-COVID Levels | Q4 2022 | Q2 2022 |
| Slot vs Table Revenue Split | 58% slots | 72% slots |
The Strip’s convention business took longer to recover. Downtown’s gaming revenue by game type showed surprising strength. Penny slots were key to Downtown’s 2022 comeback, unlike the Strip.
In 2023, Downtown’s revenue grew faster than the Strip’s. Local retirees playing video poker were more consistent than international baccarat players. The house always wins, but sometimes in different ways.
Interactive Charts: Monthly and Quarterly Revenue Fluctuations
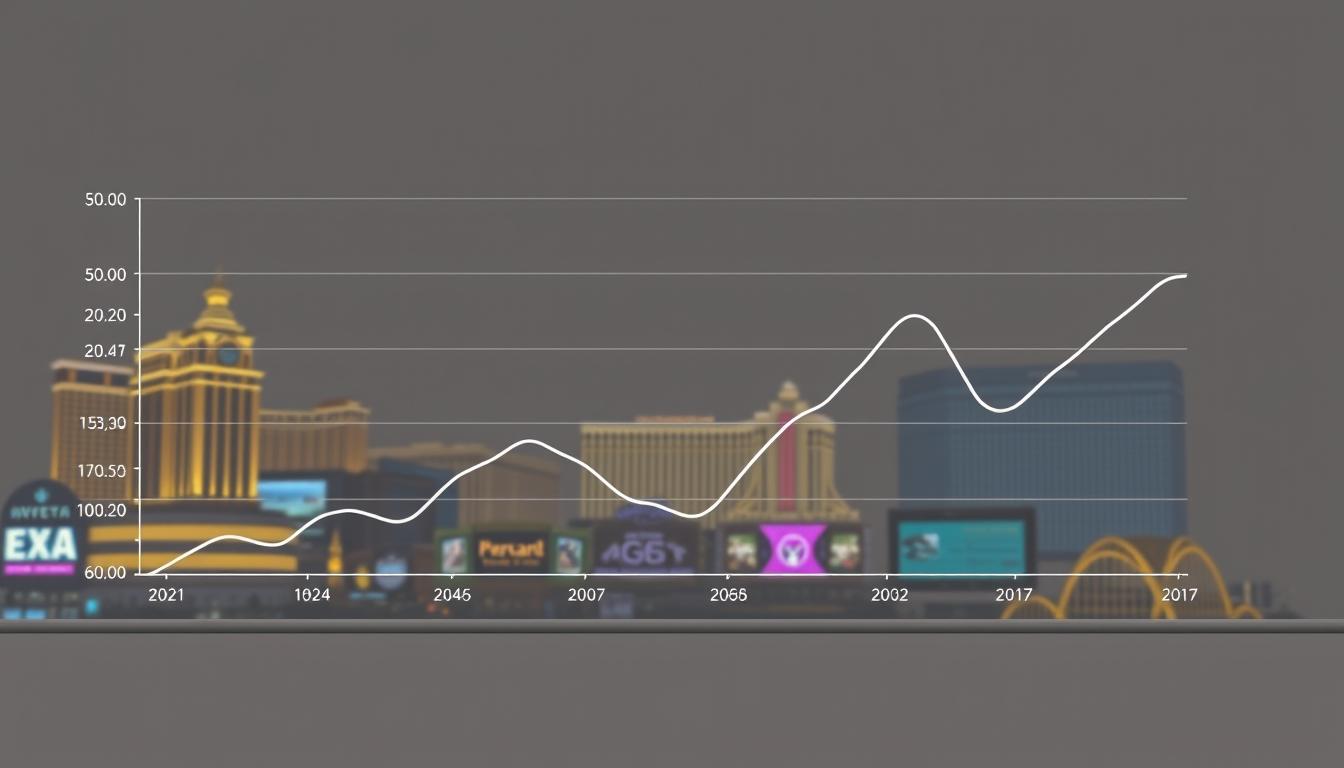
Think Vegas revenue patterns are as random as a slot machine’s payout? Our interactive charts show rhythms even DJs at XS Nightclub couldn’t replicate. These visualizations reveal when the house truly wins—and when it’s bluffing with bad cards.
Reading the Tea Leaves (Through Slot Machine Patterns)
April 2020 saw a 97% visitor drop, not just bad luck—it was economic Russian roulette. Then, October 2020 saw a 49.4% rebound: proof Vegas recovers fast. Our charts track three key Las Vegas gaming revenue impact factors:
- Convention calendars (CES turns January into a tech-bro ATM)
- Event cancellations (March Madness no-shows hit harder than 3am roulette regrets)
- Tourist psychology (post-pandemic spending sprees vs. inflation-induced hesitation)
Q1 2022 revenue spiked like a Red Bull cocktail during CES. Then, Q2 flatlined when summer heat outlasted tourist budgets. These business cycles Vegas operators face aren’t mere blips—they’re economic EKGs showing the Strip’s heartbeat.
Pro tip: Zoom out to quarterly views to spot recovery patterns post-COVID. The real money move? Cross-referencing these trends with hotel occupancy rates and convention schedules. It’s like counting cards, but legal—and with better ROI.
Key Events and Seasonality Impact
Las Vegas doesn’t have seasons – it has spending cycles. Instead of tracking snow or pollen, the Strip focuses on trade show badges and blackjack dealers. The real weather forecast is “70% chance of revenue tsunamis.”
When Conventions Cash Out
The National Finals Rodeo (NFR) is a $500M economic boost. It’s not just cowboy karaoke. Imagine 50,000 accountants from Iowa acting like high rollers.
CES turns casino floors into a Silicon Valley trust fund bacchanal. Tech bros bet Bitcoin futures between keynotes.

August in Vegas? It’s like someone unplugged the money faucet. Christmas lights sparkle in 115°F heat. Casinos rely on air conditioning as their main attraction.
March Madness weekends pre-2020 were huge. Sportsbooks made $100M+ fast. It was like saying “busted bracket” in a flash.
| Event | Timing | Revenue Impact | Key Factor |
|---|---|---|---|
| CES | January | +18% YoY | Tech expense accounts |
| Super Bowl Weekend | February | +22% slots revenue | Sportsbook overflow |
| NFR | December | $140M/week | Rodeo prize money bets |
| August Conventions | Summer | -14% vs peak | Empty conference halls |
Pro tip: Track pharmaceutical convention schedules. Nothing says “jackpot” like 10,000 surgeons with signing bonuses to burn.
Case Studies: Events, Conventions, and Revenue Spikes
Las Vegas doesn’t just roll dice – it stacks them. Let’s look at how big events turn casino floors into money machines. Tech conventions and championship fights are just a few examples. We’ll dive into how these events impact casino revenue.
The CES Effect: Tech Bros vs High Rollers
Every January, 175,000 tech fans flood Vegas. It’s a unique mix of engineers tipping dealers in Bitcoin. The Consumer Electronics Show is more than just gadgets.
It’s a study in demographic collision. Here are some numbers:
- 2019 saw 42.5M visitors, but 2020 had 19M (thanks, COVID)
- Conventions bring in 65% of non-gaming revenue during event weeks
- Table game limits triple during CES, showing the demand for tech toys
Casinos now offer more kombucha than whiskey sours during tech week. It’s surprising to see event planners taking on a new role.
When Boxing Matches Knock Out Revenue Projections
Mayweather’s 2015 fight made $72M in single-night table game revenue look effortless. This is more than New Year’s Eve’s $58M. What made it special?
- High-roller whales arrive 3 days early
- Sportsbook action spills onto casino floors
- After-parties become credit line negotiations
Cancel a major fight, and casinos lose interest fast. MGM Grand’s 2020 revenue drop was huge.
Recommendations for Forecasting and Planning
Predicting casino profits is more than just counting cards. HVS expects 2024 revenues to match 2019’s $12 billion, before COVID changed the game. Now, analysts must consider new factors like mobile sports betting’s growth and convention cancellations.
The House Always Changes the Rules
Caesars’ 2020 bankruptcy showed us to treat forecasts like Texas Hold’em. Use e-sports partnerships to hedge against UFC event cancellations. Balance CES convention spikes with summer tourism slumps.
The Las Vegas gaming revenue now includes TikTok trends and climate protests. These factors add complexity to forecasting.
Stacking Chips in Digital Arenas
Wall Street learned a lesson from DraftKings’ mobile success. Today, track Twitch streamers promoting virtual roulette as closely as airport foot traffic. To beat the Las Vegas gaming revenue forecast, watch Chinese tourism recovery and Gen Alpha’s Roblox gambling simulations.
The real jackpot is in connecting dots others ignore. When CES tech bros flood Resorts World, does their spending offset high rollers avoiding crowded casinos? Does Taylor Swift’s Eras Tour out-earn heavyweight title fights? In Vegas, every Beyoncé concert is a economic indicator – and your spreadsheet better dance to the same beat.