
Many casino marketing teams are stuck in old ways. They cling to outdated strategies, like those from the George Clooney era. The theo-based percent model is struggling to keep up. Marketing costs are rising, but teams are getting better at using data to cut expenses.
This change is making payback periods shorter. This is why reinvestment is such a big deal now.
Knowing your reinvestment rate is key to your player development. Neil Patel points out that marketing is getting pricier but more rewarding. He stresses the need to measure your ROI model performance, not just look at coin-in reports.
The costs of comps, like room stays and free play, must be closely watched. It’s like a card counter at blackjack.
So, what’s your real reinvestment rate after breakage? And what’s the cost of moving up a tier? If you can’t answer these quickly, you might be losing money. This article will help you improve your marketing dollars, step by step.
Tier ladder earn rates thresholds and breakage economics
The tier ladder is more than just a chart; it’s the core of your loyalty program. Knowing about ADT tiers is key to keeping players engaged and profitable. It’s not just about giving out rewards; it’s about creating a system that fits how players behave.
Spending should match player performance, not just follow a set plan. Studies show which tiers and formats bring in the most money. Your tier ladder should reflect real player actions, not old plans.
Earn rates are where the real math happens. A small difference in points can add up to a lot for your business. Think about how a tiny percentage change can affect your profits!
Setting thresholds right is also important. If they’re too low, you give out status too easily. If they’re too high, players might leave for better offers. Finding the right balance keeps players loyal without hurting your profits.
Breakage economics is another key area. Breakage is the value of points and benefits that aren’t used. It’s like free money, but only if you understand it well. For example, some teams might guess breakage at 40%, but it’s really around 28%. That’s a big difference!
To see these ideas in action, check out the table below. It shows different ADT tiers, their earn rates, and breakage percentages:
| ADT Tier | Earn Rate (%) | Thresholds | Breakage Rate (%) |
|---|---|---|---|
| Bronze | 1.0 | 1000 points | 30 |
| Silver | 1.5 | 2000 points | 25 |
| Gold | 2.0 | 3000 points | 20 |
| Platinum | 2.5 | 5000 points | 15 |
The link between earn rates, thresholds, and breakage is complex but important. Your tier structure should change based on what players do, not old plans. For more on tiered pricing, read this guide on tiered pricing.
Event week guardrails raise mins and comp dilution controls
Event weeks can quickly turn into a budget disaster with room comps. It’s tempting to want to reward players, but Monday morning can be a rude awakening. You might find you’ve given away a luxury room to someone who can’t even afford the mini-bar.
Every room comp during an event week is a missed opportunity. It’s not just a cost; it’s a chance to make more money. Raise those minimums during event weeks! It’s not about being mean; it’s just basic economics.
Comp dilution controls help keep your enthusiasm in check. When everyone starts making exceptions, your budget can quickly get out of control. Comp value erodes when guardrails aren’t adjusted for context.
Think about this: a room that costs $89 on a Tuesday might be $899 on a holiday Saturday. Your comp strategy should reflect these changes, not ignore them. Let’s make smart choices about room comps during event weeks to keep our finances healthy.

Uplift modeling incremental profit vs comp cost by tier channel
Ever wondered if your marketing dollars are really worth it? Uplift modeling might just be the answer. It’s key to knowing the difference between spending and actual profit.
Let’s say a player gets a $500 comp offer and visits, bringing in $4,000 in revenue. Sounds good, right? But, would they have visited without the offer? If yes, then your ROI model is giving credit for something that would have happened without your help. That’s not profit; that’s giving extra.
True uplift modeling shows the incremental profit. It’s the difference between what happened and what would have happened without the offer. By looking at data by tier and channel, you can see which offers work best. For example, maybe your high-end players love room comps but ignore food and drink offers.
Without uplift analysis, you’re just guessing. But with it, you’re making smart choices. The idea of multi-touch tracking is important here. Players interact with different offers before making a decision. Simple last-touch attribution misses most of the value. Neil Patel’s point about faster payback through better analytics is real. It comes from knowing which offers really make a difference.
In conclusion, uplift modeling helps separate what’s important from what’s not. By understanding what drives player behavior, you can use your resources better. This way, you’ll see real returns on your marketing investments.
Host discretion playbook caps caveats audits with exceptions
In the game of host offers, intuition is like a wild card. But structure is your ace. This mix of human judgment and analysis can either boost your strategy or cause chaos.
Host discretion is a powerful tool. A skilled host can read a player’s mood and relationship dynamics like a diplomat. But, this skill needs clear rules to avoid chaos.
I’ve seen host offer logs that look like a generous uncle’s will. Everyone gets something, without logic. That’s where the playbook comes in. It needs hard caps. These caps should need VP-level approval, not just a quick text to a supervisor.
Caveats are also important. A host can give more if the player’s past spending supports it or if they might leave for a rival. This approach makes sure every decision is data-driven, avoiding reckless spending.
Monthly audits with exceptions are key. They review every override, not to punish but to learn. They help find out which hosts spend too much and which trips are worth it.
By structuring host discretion, you can turn risks into advantages. It’s not just about spending wisely. It’s about building relationships that bring loyalty and repeat business.
| Key Elements | Description | Impact on Marketing |
|---|---|---|
| Host Discretion | Balancing intuition with structured oversight | Enhances player relationships |
| Hard Caps | Limits on comp allowances requiring approval | Reduces financial risk |
| Caveats | Conditions under which allowances can be exceeded | Increases strategic spending |
| Audits | Monthly reviews of host overrides | Improves accountability and learning |
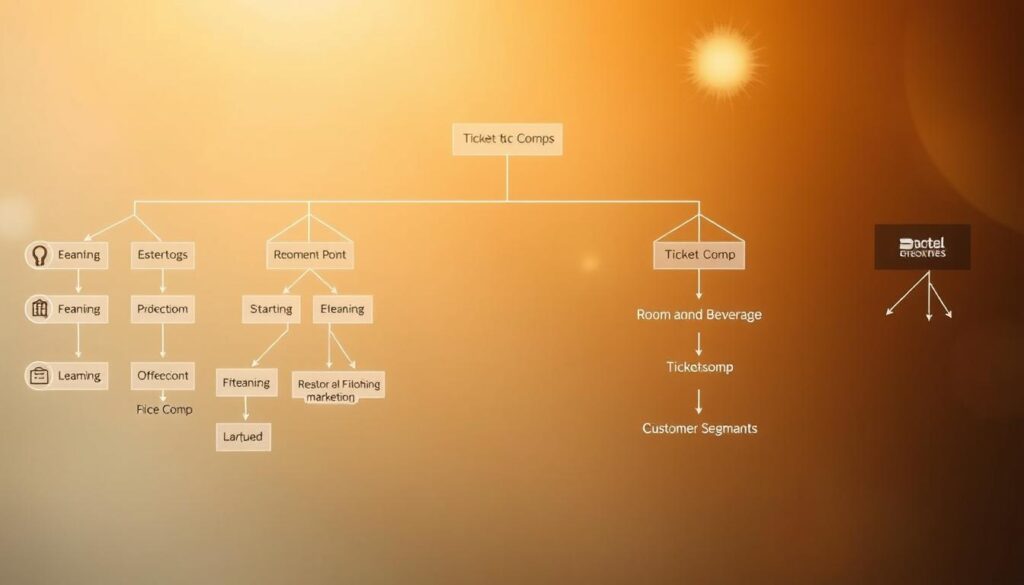
Room vs F and B vs ticket comp decision tree by event and segment
Comps have different uses for different players. A room comp shows status and convenience, saying, “You belong here overnight.” F&B credit offers hospitality, inviting guests to “enjoy yourself on us.” Ticket comps, on the other hand, show exclusivity, saying, “You’re important enough to be in the room where it happens.”
The choice of comp depends on the event, player segment, and their past actions. For example, a high-value player during a big event might prefer a ticket. They were likely to book a suite already. But a regular player during a quiet week might choose F&B credit more.
It’s important to remember that not all comps are the same. It’s about what motivates each player. Create a decision tree, train your staff, and check how it works. A $300 room comp and a $300 F&B credit might look the same on paper. But they can have very different effects in real life.
Case SB ROI HL vs premium mass vs core mass comparison
Let’s look at the Super Bowl weekend and explore the ROI secrets of three player groups. Imagine three groups at the same event, but their results are very different. This study shows how different ways of giving out comps can lead to big differences in results.
The high-limit players, at the top of ADT tiers, made a lot of money. But, they spent the least on comps compared to their earnings. Why? These players are like tax lawyers, always looking for ways to save money. They know how to get the most value from their comps.
The premium mass segment, with good ADT and regular visits, had the best ROI. They spent less on comps and made more money. They also went on more trips after the event. This shows that personal offers can really help.
The core mass segment might have smaller numbers, but they were very efficient. They did well when comps were food and drinks, not hotel rooms. This shows the importance of looking at how people behave, not just their numbers.
Choosing the right segments is key, as Source 2 says. Looking at total theo might impress, but it’s the profit by segment that really matters. Cutting out the unprofitable parts can really help, as Neil Patel notes.
For example, moving just 15% of the high-limit comp budget to the premium mass could have added six figures to net profit. The same event, same total comp spend, but a different strategy. This shows the power of comparing ROI by segment.
| Segment | Comp-to-Revenue Ratio | Incremental Revenue | Trip Frequency Uplift |
|---|---|---|---|
| High-Limit Players | Least Efficient | High | Low |
| Premium Mass | Most Efficient | Moderate | High |
| Core Mass | Moderately Efficient | Low | Moderate |

Dashboards daily comp burn vs budget with alerts
Imagine getting daily updates on your comp burn. This lets you change plans before it’s too late. No more surprises at the monthly review.
Managing your reinvestment rate becomes exciting with daily dashboards and alerts. You see comp burn by tier and property, updated every day. It’s like having a financial safety net that warns you before you go too far.
There are color-coded alerts: yellow at 90%, orange at 100%, and red at 110%. It’s not about scolding; it’s about helping you make quick decisions. For example, if premium mass is burning too much on Wednesdays, you might reduce offers on Thursdays.
And when you’re under budget in core mass, you can invest in other areas. This approach is like following Neil Patel’s advice—use data to guide your next steps.
Are you ready to make your reinvestment strategy more dynamic? With daily updates, your budget can work for you. Remember, in marketing, timing is everything.
Testing cadence control groups for new offers
Control groups are key in marketing tests. They help us see if new offers really make a difference. When a new offer comes out, everyone gets excited. But then, someone asks if people would have visited without the offer.
This question shows we don’t always know if our offers are truly effective. To find out, we need to use control groups. These groups get either no offer or a standard one. This lets us see how new offers compare to the usual ones.
Testing different offers and how they’re presented is important. For example, you could test two offers: one with just room comp and another with room comp plus F&B credit. You could also see if email or SMS works better, or if Tuesday or Thursday is the best day to send offers. Testing regularly, like every quarter, helps you adjust without overwhelming people.
Neil Patel says a good plan for improving conversion rates can save money. Every test that shows an offer isn’t working saves money. On the other hand, tests that show a good offer can help you use your resources better. Control groups are like an insurance policy for your marketing budget.
To improve your ROI model, using control groups is essential. They help us understand if offers really change behavior or just help people do what they already do. So, when you introduce a new offer, think about its long-term effect on your audience.
For more tips on improving your marketing, check out our guide on the seat supply model.
FY plan reduce waste protect top line
In our quest for a better marketing strategy, we must focus on cutting waste and keeping our revenue high. It’s not just about cutting costs; it’s about using our resources wisely. McKinsey found that 15-20% of marketing money could be used for growth instead.
Think about the player who keeps getting the same offer every month, even if they’re not interested anymore. Or the person who gets free stuff at events but would have paid for it. These are big mistakes that cost us a lot.
We need to focus on what really works, not just stick to old budgets. Companies are finding that better data analysis means faster returns. We should make sure every comp dollar is worth it, based on solid data and results.
In a world where staying alive is a challenge, being good at reinvestment is key. Those who use reinvestment wisely will not only do well but also keep their players and profits up during hard times. Let’s make every dollar count, one smart comp at a time.