
Welcome! Let’s explore the numbers that show how the Las Vegas Strip started 2026. The first three months are interesting. It’s a time when the market adjusts after the holidays. We aim to explain this adjustment and its significance.
The data shows a strong start. Strip gross gaming revenue fell about 11% year-over-year in January, reaching around $747.7 million. The main reason was a big drop in baccarat hold, down nearly half from last year. But, it’s not because fewer people were playing.
This drop was mainly due to the “luck factor” returning to normal after an unusual period. Yet, slot gaming showed strength, even rising a bit. Analysts and casino leaders are now cautiously optimistic about the future.
We’ll make these reports and comments easy to understand. This will give you a clear view of the recovery signs everyone is looking for. For more detailed insights and monthly reports, check out VegasRevenue.com. Now, let’s dive into the performance by operator and segment to understand the whole picture.
Q2 Deep Dive: Convention Season Impact and Spring Gaming Patterns
Ever wondered how big trade shows boost casino wins? The second quarter reveals the answer. Spring is when Las Vegas truly shines as a global business hub.
This time offers a peek into a steady economic engine. Unlike leisure travel, conventions provide a reliable visitor surge. For 2025, Las Vegas welcomed about 6 million convention-goers, close to 2024’s numbers.
Imagine a big convention center as a giant funnel. It pulls in thousands of professionals for work, then sends them to the Strip for fun. This creates a direct flow of gamers to casino doors.
The data shows this funnel’s power. In December 2025, convention attendance rose by about 9.6%. This trend continued into early 2026, with attendance growing each month.
All these visitors need places to stay. That’s where Strip performance metrics like hotel occupancy and RevPAR come in. RevPAR shows how much money a hotel makes from each room.
After some dips, RevPAR went up in January 2026. Full hotels and higher room rates show strong demand and spending power. A busy hotel lobby means a busier casino floor.
This cause-and-effect is clear in the quarterly gaming reports for Q2. Spring gaming patterns show a clear uplift tied to big trade shows and conferences. Table game pits and slot banks get busier from these visitors.
Operators get ready for this spring uplift. They add more staff, tailor marketing to business travelers, and keep properties lively. It’s a planned revenue boost that balances out other quarters.
This focus on business travel shows a changing tourism landscape. It shows how the city adapts to economic shifts. The Q2 deep dive proves that convention season is key to the Strip’s financial success.
By tracking these spring patterns, you get a clearer view of the market’s health. The quarterly gaming reports tell a story of planned success, driven by the steady beat of convention business.
Q3 Analysis: Summer Heat Challenges and Event-Driven Revenue
You might think fewer visitors mean less money, but the Strip’s Q3 performance often tells a different story. The summer quarter, from July to September, is a lesson in adapting. Even with the heat, smart operators boost their top offerings.
The data shows the first part of the story clearly. In June 2025, the LVCVA reported a drop of over 11% in visits. Higher travel costs and softer consumer confidence kept some at home. This looks like a big challenge for businesses.
But here’s where it gets interesting for those studying quarterly gaming reports. Despite fewer visitors, 2025’s gaming revenue actually edged up. This is thanks to a shift in strategy: focusing on higher-end play.

Think of it this way. Instead of relying on many casual visitors, resorts target fewer, but higher-staking, guests. These premium players spend more on luxury suites, fine dining, and exclusive experiences. This “premium play” segment helps make up for fewer visitors.
The summer also benefits from event-driven revenue. When it’s hot, big concerts, fights, and residencies are the main attraction. A single big weekend can turn a slow period into a financial success. These events bring in crowds ready to spend, not just on tickets but across the whole casino and resort.
So, looking closely at Q3 quarterly gaming reports teaches us a key lesson. It’s not just about the number of visitors. It’s about who they are and what they do. By focusing on top-notch hospitality and entertainment, Las Vegas doesn’t just survive the summer heat—it thrives.
Q4 Breakdown: Holiday Gaming Surge and Year-End Performance
December’s visitor numbers might tell one story, but the year-end revenue totals reveal a far more powerful narrative about the Strip’s financial resilience. This final act of the year is where the magic happens, and a deep dive into this period is key for any gaming industry quarterly analysis.
Q4 is a blockbuster season. It’s filled with Thanksgiving crowds, Christmas vacations, and epic New Year’s Eve parties. The Strip is packed with leisure visitors ready to celebrate and spend. This creates a natural, powerful surge in gaming activity across casinos.
But 2025 presented a fascinating case study. December visitation totaled about 3.1 million visitors. That was actually a drop of roughly 9.2% from some previous highs. At first glance, that might seem like a concern for the year’s final scorecard.
Here’s the twist. Despite that dip, the 2025 Strip gaming revenue soared to a record ~$8.8 billion. How is that possible? The answer lies in a strategic shift from counting heads to measuring the value of each player. It’s a core lesson from modern quarterly gaming reports.
Think of it like a restaurant. A fully booked night with 100 people ordering burgers is good. But a night with 90 people ordering steak, wine, and dessert is often far more profitable. Q4 2025 focused on attracting that second group.
A major driver of this success was brilliant pre-planning. The LVCVA’s “Fabulous Five-Day Sale” in September 2025 is a perfect example. This promotion drove massive engagement and booking interest for the holiday period months in advance.
It locked in high-intent visitors who were planning to spend. These weren’t just casual tourists. They were guests committed to a premium Las Vegas experience, which directly translates to longer casino time and higher average bets.
The table below contrasts a typical Q4 with the strategic approach seen in 2025’s successful year-end performance:
| Metric | Typical Q4 Focus | 2025 Q4 Strategy | Resulting Insight |
|---|---|---|---|
| Visitation Mindset | Maximize total headcount | Attract high-value, pre-committed guests | Quality of visitor can outweigh quantity. |
| Gaming Revenue Driver | Volume of players | Higher spend per player (table games, premium slots) | Revenue hit record levels despite lower traffic. |
| Promotional Timing | Last-minute holiday deals | Early-bird sales (e.g., Fabulous Five-Day Sale) | Early promotions secure valuable holiday bookings. |
| Key Performance Indicator | Hotel occupancy rate | Revenue per available room (RevPAR) & gaming win per visitor | Metrics shifted to emphasize profitability. |
| Overall Outcome | Strong seasonal finish | Record-breaking annual revenue closure | Strategic Q4 planning can cement a winning year. |
So, what does this mean for your understanding of the market? It shows that a smart gaming industry quarterly analysis looks beyond surface-level numbers. The holiday season’s power isn’t just in crowds. It’s in the ability of operators to create irresistible offers that capture premium player spending.
This Q4 breakdown proves that with the right promotions and a focus on player value, the Strip can turn any holiday season into a historic finale. That’s how you build towards an ~$8.8 billion year.
Revenue Segment Analysis: Slots, Table Games, and Sports Betting by Quarter
Looking closer at total revenue, we see the unique patterns of slots, table games, and sports betting. Each one has its own way of performing from quarter to quarter. Understanding these casino revenue segments is key to reading financial reports like an expert.
Let’s explore further. You’ll learn how one segment’s downturn can affect a whole quarter. Another segment might quietly grow in the background. By the end of this section, you’ll know what to look for.
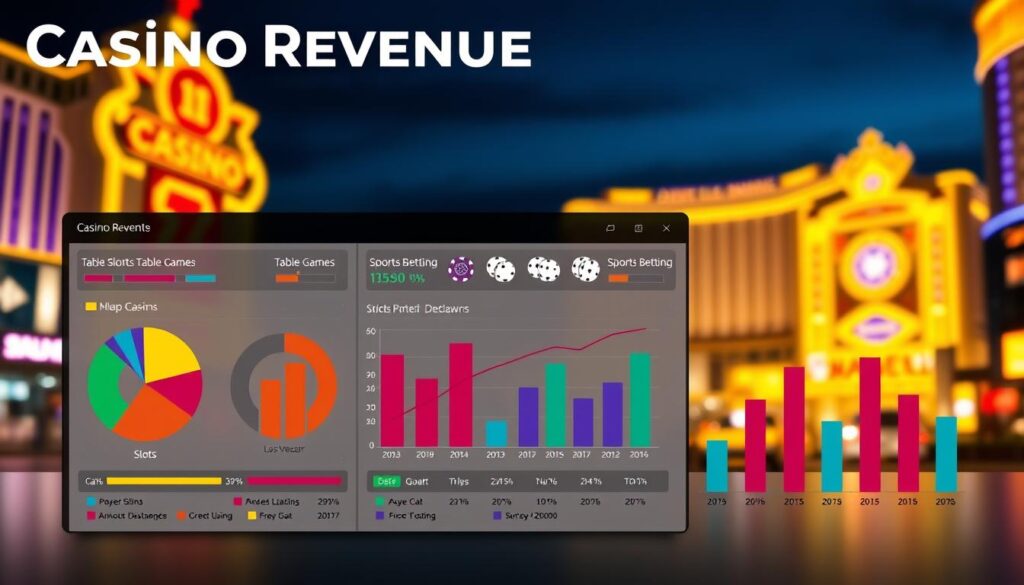
Slot revenue is often the most consistent. It’s like a steady paycheck for casinos. Thousands of machines are played constantly.
In early 2026, slot gaming revenue saw a small increase. This growth is thanks to premium slots—high-limit machines that attract bigger bets. Slots have a more predictable win rate for the house, which helps smooth out quarterly results.
Their performance is a core part of any Strip performance metrics review. When slots are up, it provides a solid foundation, even if other areas struggle.
The High-Stakes Rollercoaster: Table Games
Table games, like baccarat, blackjack, and roulette, are much more volatile. One game can make or break a quarter.
Remember the January 2026 data? While slots grew, baccarat collapsed. This single drop can explain why a quarter’s total revenue might disappoint, even if other areas are fine.
Here’s a key concept: hold percentage. This is the casino’s “cut” of the money wagered. For table games, the hold percentage varies wildly. A lucky streak for players means a low hold. A lucky streak for the house means a high hold. The 2025 strength in table games was partly due to “favorable hold percentages.” The casino simply won a higher-than-average share of the bets.
The New Contender: Sports Betting
Sports betting is the newest major segment. Its revenue is tied to the sports calendar. Big events like the Super Bowl or March Madness create huge spikes in a single quarter.
Unlike slots, sports betting revenue isn’t about constant play. It’s about capturing massive waves of interest during key seasons. This makes its quarterly pattern look very different—full of peaks and valleys.
Quarter-by-Quarter Segment Behavior
So, how do these pieces fit together each quarter?
- Q1: Often impacted by post-holiday trends. A baccarat crash (like in early 2026) can overshadow steady slot performance.
- Q2 & Q3: Convention season and summer tourism boost all segments. Table game hold percentage becomes a major swing factor.
- Q4: Holiday crowds and major sporting events drive surges. Slots and tables benefit from visitors, while sports betting has its own major events.
Next time you see a headline about quarterly revenue, ask yourself: “Which engine drove it?” Was it the steady hum of slots, a wild swing at the tables, or a sports betting bonanza? Now you have the tools to find out.
Operator Performance: MGM, Caesars, Wynn, and Las Vegas Sands Quarterly Comparison
Imagine four star quarterbacks on the same team – each with different strengths that shine in different game situations. That’s exactly how MGM, Caesars, Wynn, and Las Vegas Sands operate on the Las Vegas Strip! Their quarterly performance tells a fascinating story of diverse strategies and market positioning.
When we analyze Strip performance metrics, we’re not just looking at numbers. We’re uncovering how each company’s unique approach to hospitality, gaming, and entertainment creates distinct financial patterns throughout the year.
Let’s start with the basics. Each operator brings something special to the table:
- MGM Resorts operates the largest portfolio of properties, giving them incredible market reach
- Caesars Entertainment focuses heavily on conventions and loyalty programs
- Wynn Resorts targets the ultra-luxury segment with impeccable service
- Las Vegas Sands emphasizes integrated resort experiences and non-gaming revenue
These different approaches mean their quarterly results can vary dramatically. A great convention season might boost Caesars in Q2, while summer luxury travel could lift Wynn in Q3.
Here’s a snapshot of how these operators typically perform across quarters. Remember, these patterns help us understand the broader gaming industry quarterly analysis landscape!
| Operator | Q2 Strength | Q3 Highlight | Q4 Performance | Key Differentiator |
|---|---|---|---|---|
| MGM Resorts | Convention traffic | Pool season revenue | Holiday entertainment | Property diversity |
| Caesars Entertainment | Loyalty program usage | Weekend hotel packages | New Year’s events | Convention focus |
| Wynn Resorts | High-end dining | International luxury travelers | Exclusive holiday experiences | Ultra-premium positioning |
| Las Vegas Sands | Meeting space bookings | Integrated resort stays | Corporate holiday parties | Non-gaming revenue mix |
Notice how each company’s strategy creates unique quarterly rhythms. MGM’s diverse property portfolio helps them weather seasonal changes better than most. They have something for every type of visitor!
Caesars’ convention-heavy approach makes Q2 their sweet spot. When business travelers flood the Strip for conferences, Caesars properties fill up first. Their loyalty program keeps these visitors coming back throughout the year.
Wynn’s luxury focus pays off beautifully in Q3. Summer brings international high-rollers and luxury seekers who appreciate their impeccable service. These guests spend significantly more per visit than average tourists.
Las Vegas Sands emphasizes what we call “integrated resort economics.” They make money from hotels, dining, shopping, and entertainment – not just casino floors. This diversified approach creates more stable revenue across all quarters.
When conducting gaming industry quarterly analysis, we must consider these operator differences. Comparing them directly without understanding their strategies would be like comparing apples to oranges!
The “Average Big Strip Casino” reports reveal something critical. While all major operators face similar market conditions, their responses differ dramatically. One might invest in new nightclubs for summer revenue. Another might upgrade convention facilities for spring business.
Your key takeaway? Successful Strip performance metrics analysis requires understanding each operator’s playbook. MGM plays the volume game. Caesars bets on business travel. Wynn courts the elite. Sands builds complete destination experiences.
Next time you see quarterly earnings reports, you’ll know exactly what to look for. You’ll spot how convention season impacted Caesars. You’ll notice when luxury travel boosted Wynn. You’ll become a savvy observer of the Strip’s competitive dance!
This quarterly comparison gives us powerful insights. We can predict which operators will shine in which seasons. We understand why their financial results differ even when they’re neighbors on the same famous street.
Market Share Shifts: Quarterly Changes in Competitive Landscape
The real story of the Strip’s competition is in the small changes each quarter. Total revenue numbers get all the attention. But it’s who gets the biggest share of the pie that really matters.
Think of it like this: the market can grow, but one company can grow faster. This means its power can increase. That’s why looking at Strip performance metrics is key to understanding the competition.
Small changes each quarter might seem small, but they add up quickly. A one-percentage-point gain can mean tens of millions in revenue. Tracking the “Average Big Strip Casino” reports over time shows these small changes add up to a big picture.
Let’s look at a simplified snapshot of how market share can change from quarter to quarter. The table below shows hypothetical but realistic shifts based on real performance data.
| Operator | Q1 Share | Q2 Share | Q3 Share | Q4 Share |
|---|---|---|---|---|
| MGM Resorts | 34.2% | 33.8% | 34.5% | 35.1% |
| Caesars Entertainment | 28.5% | 29.0% | 28.0% | 27.5% |
| Wynn Resorts | 14.0% | 14.3% | 14.8% | 15.0% |
| Las Vegas Sands | 12.8% | 12.4% | 12.2% | 12.0% |
MGM lost a bit of ground in Q2 but came back strong by the end of the year. Caesars did well in the spring but faced challenges later. These are the strategic moves hidden in plain sight!
What causes these shifts? It’s rarely just one thing. A new loyalty tier can attract players. A hit nightclub or restaurant can draw a different crowd. Even renovations can boost a property’s appeal.
Every quarter is a new chapter in this relentless race. By focusing on share, you see who is executing their strategy best. You move from just reading numbers to understanding the game itself.
This dynamic view of performance on the Strip is your key to predicting who might lead tomorrow. The battle for market share never sleeps, and neither does the insight it provides!
Economic Correlation: GDP, Employment, and Consumer Confidence Impact
Imagine the U.S. economy as a tide, and Las Vegas tourism as the boats in its harbor. When the tide rises, so do they. The Strip’s fortunes are tied to the national economy’s health.
To predict the Strip’s success, we must grasp three key factors: GDP, employment, and consumer confidence.
Gross Domestic Product (GDP) shows the country’s total economic output. When it grows, people feel richer. This boosts spending on luxury, like Vegas trips.
National employment rates are also vital. More jobs mean more stable incomes. This is good for the gaming industry quarterly analysis.
Consumer confidence is the emotional pulse of spending. It’s a survey that gauges people’s optimism about their finances and the economy. High confidence means more spending.
For example, a 2025 tourism drop was linked to softening confidence and rising travel costs.
When confidence is high, the holiday quarter (Q4) sees a big boom. People want to celebrate and spend. But, when budgets are tight, summer travel (Q3) feels the pinch, even with big events.
So, how do these indicators affect casino floors? Stable employment means people can afford bigger bets and higher-denomination slots. It’s a direct link from a steady paycheck to casino spending.
This connection turns you into a forecaster. By watching national economic reports, you can predict Las Vegas revenue trends. The table below shows this relationship clearly.
| Economic Indicator | When It’s Strong | Direct Impact on Vegas Gaming | Typical Quarterly Effect |
|---|---|---|---|
| Consumer Confidence | Survey scores are high and rising. | Increased spending on travel, hotels, and non-gaming amenities. Higher average casino spend per visitor. | Major boost to Q4 holiday revenue. Can soften Q3 if confidence falls during summer. |
| National Employment | Low unemployment, strong wage growth. | More stable discretionary income for gaming. Supports higher casino “trip budgets” and longer stays. | Positive effect across all quarters, providing a stable baseline of demand. |
| GDP Growth | Economy is expanding robustly. | Creates a general sense of prosperity. Encourages corporate travel, conventions, and high-end play. | Strong Q2 and Q4, as business and leisure travel intersect with economic optimism. |
A report on rising “Casino Employment” in Nevada is a result. National employment and confidence figures are often leading causes. By monitoring the causes, you get ahead of the curve.
Mastering this economic analysis of gaming is key to forecasting. You’re not just looking at last quarter’s Strip numbers. You’re understanding the national winds that fill its sails.
Cost Analysis: Operating Expenses and Profit Margin Trends by Quarter
Understanding casino revenue segments is key, but knowing costs is what really matters. Revenue shows money coming in. But, operating expenses show money going out. Let’s look at where money goes and see the profit margin.
Think of a big Strip resort like your household budget, but with many more zeros. The biggest expenses are people, promotion, and entertainment. For an average big Strip casino, labor is the biggest expense. Thousands of employees keep the casino running 24/7.
Next, there’s the entertainment budget. This isn’t just for weekend shows. It includes big residencies, nightclub DJs, and pool parties. Marketing and promotion costs also vary a lot. A casino might spend a lot in Q1 to attract visitors after the holidays or launch a new campaign.
Then, there are utilities, property maintenance, and gaming taxes. Keeping the casino running isn’t cheap. These are the essential costs of doing business on the Strip.
How Costs Dance with the Calendar
Expenses don’t stay the same all year. They have their own quarterly trends. The first quarter often sees a spike in marketing spend. Operators are pushing to recover from the post-holiday slump and attract convention traffic.
Summer (Q3) is when entertainment costs can skyrocket. With major headliners and packed event schedules, the cost of putting on a spectacle hits its peak. Labor costs also remain high to handle the tourist influx.
By the fourth quarter, marketing might stabilize, but labor stays elevated to manage the holiday crowds. The key for operators is managing this ebb and flow. Can they grow revenue faster than these rising costs?
The Bottom Line: Profit Margin is King
This brings us to the most important number: the profit margin. It’s simple math. You take all the revenue, subtract all the operating expenses, and see what percentage is left as profit. A rising margin means a casino is becoming more efficient—making more money on each dollar of revenue.
A falling margin is a warning sign, even if revenue is up. It means costs are growing faster than sales. Tracking margin trends by quarter gives you the clearest picture of operational health and management skill.
| Expense Category | Q1 | Q2 | Q3 | Q4 |
|---|---|---|---|---|
| Labor Costs | High | Moderate | Very High | High |
| Marketing & Promotion | Very High | High | Moderate | Moderate |
| Entertainment & Amenities | Moderate | High | Peak | High |
| Utilities & Property Costs | Stable | Stable | Stable (High Usage) | Stable |
| Estimated Operating Margin | Moderate | Strong | Variable (Event-Dependent) | Strong |
Look at the table above. It shows how expense focus shifts each quarter for an average major property. Q1’s high marketing spend aims to boost revenue, hopefully leading to a decent margin. Q2 often shows a strong margin as convention business flows in with more predictable costs.
Q3 is the wildcard. Massive entertainment spending can either create huge revenue and good margins or become a cost burden if shows don’t sell out. This is the power of operating leverage. Q4 usually sees strong margins from holiday gaming, with costs more under control.
So, when you look at those big revenue numbers, always ask about the costs behind them. Sustainable success on the Strip isn’t just about winning at the tables; it’s about winning the battle of the balance sheet. Mastering the flow of both money in and money out across all casino revenue segments is the final piece of the quarterly puzzle.
Forward Guidance: Operator Projections and Market Expectations
After looking at costs and margins, we now look to the future. Big names like MGM and Caesars are hopeful for early 2026. Experts at Truist Securities and J.P. Morgan are keeping an eye on the next quarterly gaming reports for a recovery sign.
The gaming industry quarterly analysis shows a big change. The global casino market is expected to grow a lot, thanks to the integrated-resort model. You can find more about this in a global market forecast. This move to non-gaming revenue is key for future earnings.
In Las Vegas, the competition gives us hints. Properties that update often do well in occupancy and revenue. Looking at the local market dynamics shows how important segment mix and visitor targeting are. The opening of new resorts like Resorts World will test customer loyalty.
Important things to watch include the strength of conventions, how well consumers spend, and the growth into premium mass gaming and entertainment. Also, how slots and table games do will show the market’s health.
We now have a clear view of the past quarters. You’re ready to make your own guesses for the next quarterly gaming reports. Keep an eye out for operator updates and analyst notes—they’ll share the next part of the story!