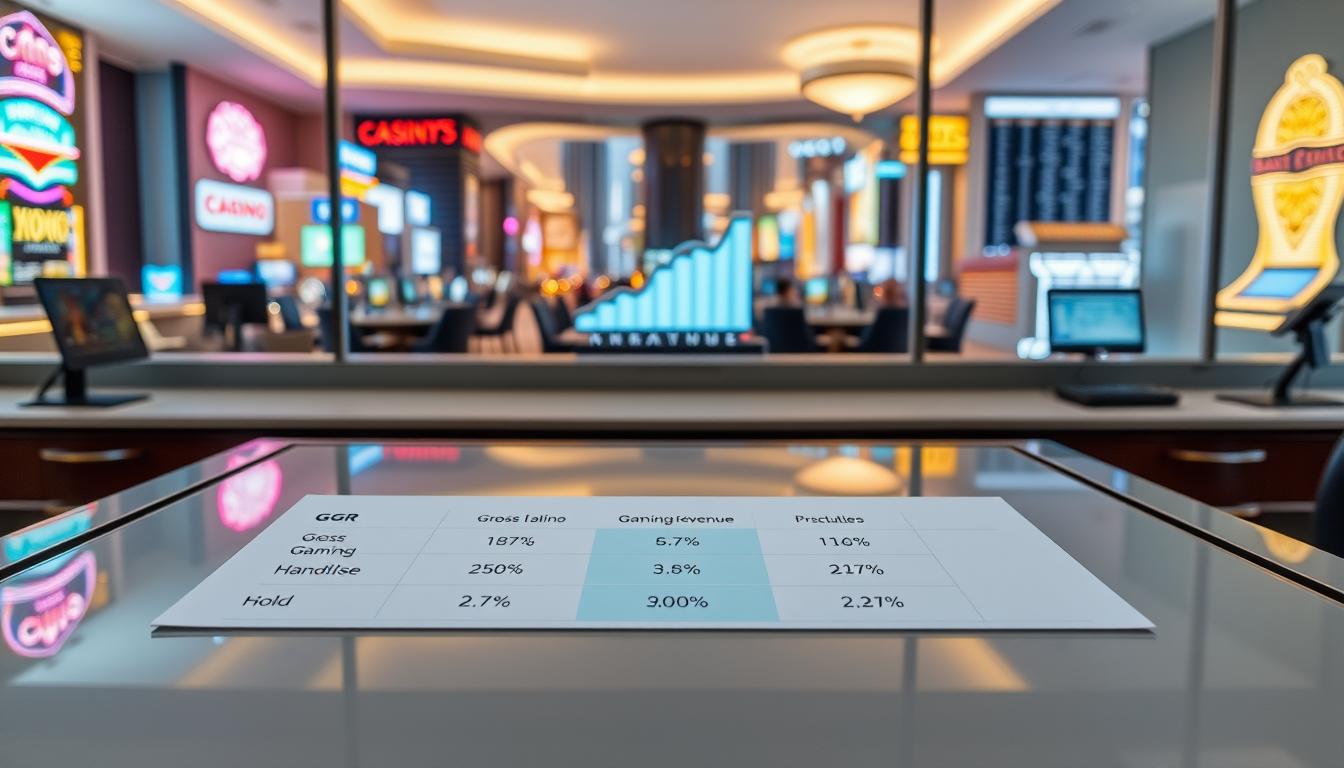
Ever wonder how casinos make money while giving out free drinks and pretending to care about your luck? Let’s uncover the industry’s favorite financial terms.
Gross Gaming Revenue (GGR) isn’t the total money you lose. It’s what the house keeps after all those “almost wins” that keep you coming back. Think of it as the casino’s net profit after paying out your occasional small victories.
Then there’s handle, the total amount wagered. This measures everything flowing through the system before the house takes its cut. It’s like counting all the water flowing through pipes before the casino’s reservoir collects its share.
The magical hold percentage determines whether the house actually wins or just pretends to while comping your cocktails. This number is the casino’s version of “the force” – it surrounds us, penetrates us, and binds the entire gambling economy together.
Understanding these concepts reveals the fascinating operator market share evolution happening behind the scenes. It’s where financial reality meets the illusion of chance.
Historical Share 2015–Present
Remember when MGM was the top dog on the Las Vegas Strip? Those were simpler times. Now, Wynn builds huge resorts and Caesars plays with debt. The casino world has seen big changes from 2015 to today.
The late 2010s saw a big shake-up. Eldorado bought Caesars, creating a giant in the gaming world. This changed who got a slice of the market share pie.
Sheldon Adelson’s ghost is felt in Singapore. His Marina Bay Sands changed what luxury gaming means. He played a game of real estate and customer targeting, unlike others.
The pandemic changed everything fast. Casinos that relied on conventions lost a lot. But regional casinos with local players did well.
Analyst upgrades and downgrades tell a story:
- MGM’s 2019 downgrade due to concerns about regional exposure
- Wynn’s 2021 upgrade when Macau’s future looked brighter
- Caesars’ big change from junk to investment grade after merging
The data shows interesting patterns. It’s like watching Game of Thrones, but with more bankruptcy threats. Properties that kept customers during tough times did better.
Stock performance is like a thriller. Companies that spread their income streams did better than those betting on Las Vegas. The smart money went to those with regional strength and digital options.
Today’s casino world is very different from 2015. The players and rules have changed, and the stakes are higher. But one thing stays the same: in casinos, the house always wins. But which house wins the most keeps changing.
Pandemic Dislocations and Recovery Paths
COVID-19 hit the gaming industry hard, like a master thief. Casinos emptied fast, leaving operators in a rush to find ways to recover.
MGM’s share took a big hit, like a boxing match. Casinos were almost empty, with no money coming in.
Recovery efforts have been all over the place. Some places bounced back quickly, while others are struggling.
Leisure demand is slow, like a sleepy high-roller at Wynn. Places that rely on visitors are really struggling.
The pandemic changed everything. Q3 2025 shows that recovery is not just going back to how things were. It’s about creating something new.
MGM’s share recovery is complex. Some places are doing well, while others are not. The pandemic changed the rules of the game.
Segment Share: slots, tables, sportsbook, rooms, non‑gaming
Ever wonder which casino segments actually pay the electric bill? The answer might surprise you more than finding an empty parking spot on the Las Vegas Strip.
Let’s play everyone’s favorite revenue detective game. We’re digging into the fascinating economics behind each gaming segment. Some quietly print money while others swing wildly like a political pendulum.

Slot machines remain the undisputed champions of casino revenue. These digital workhorses generated a solid 5% growth in Vegas last year. They’re the reliable breadwinners that keep the lights on.
Why do casinos love slots? Consistent hold percentages and minimal staffing requirements. They’re the steady-Eddies of the gaming floor.
Table games tell a different story. Their hold percentages swing more dramatically than public opinion polls. Baccarat tables can experience volatility that makes cryptocurrency look stable.
Here’s the delicious irony: games with the lowest margins often attract the biggest whales. It’s a casino economy more paradoxical than a luxury budget hotel.
Sportsbooks are having their moment in the spotlight. Handles are predicted to jump 17% this year. Yet NFL hold percentages remain more unfavorable than a controversial court ruling.
Meanwile, non-gaming revenue continues its struggle. Those fancy restaurants and overpriced shows? They’re fighting harder than a tourist trying to navigate Strip traffic.
| Segment | Revenue Share | Growth Trend | Volatility |
|---|---|---|---|
| Slots | 45% | +5% (Vegas) | Low |
| Table Games | 25% | +2% | High |
| Sportsbook | 15% | +17% (projected) | Medium |
| Rooms & Non-Gaming | 15% | -3% | Low |
The slot/table share dynamic reveals casino operators’ preferred revenue mix. Slots provide stability while tables offer glamour and whale hunting opportunities.
Sports betting’s growth can’t be ignored either. It’s becoming the new frontier for customer acquisition and engagement.
Ultimately, each segment plays its part in the casino ecosystem. Some segments pay the bills while others create the excitement that draws crowds.
Loyalty Ecosystems and Cross‑Property Wallet Share
Caesars is not just playing games with loyalty; they’re playing a complex game with your money. Their regional properties saw a 6.2% year-over-year growth. This is impressive, even for Wall Street.
So, what’s their secret? It’s a loyalty program that’s like a super-smart AI. It doesn’t just focus on one place; it aims to capture your entire gambling world.
Imagine this: why just lose money on Saturday nights when they can take your Tuesday slots and Thursday sports bets too? Their system tracks your spending across different states, like a financial detective.
Customers don’t just visit one place; they jump between casinos like they’re at a party. The loyalty program keeps them coming back, like a golden handcuff.
Here’s what makes their approach stand out:
- Real-time rewards across all properties
- Tier status that’s more than just free parking
- Personalized offers that know you better than your bartender
- Smooth transition between online and offline gambling
Caesars’ share of your spending is not just growing; it’s getting smarter. Their algorithms can guess your next bet before you even think about it. It’s loyalty at its finest, turning casual gamblers into brand fans who spread their losses everywhere.
This isn’t just about free stuff and buffets anymore. It’s about creating a world so good, you don’t want to leave. The data shows they’re winning this game, one loyal customer at a time.
M&A and Asset-Light Strategies (sales/leases/management)
Why buy the cow when you can lease the milk and sell the cream? The casino industry’s financial makeover is quite dramatic. It’s like Extreme Home Makeover, but with real estate.
Operators are playing real estate musical chairs, and the game hasn’t stopped. It started in 2020.
The consolidation frenzy is like a high-stakes poker game. Everyone’s betting big. Major players are getting rid of physical assets fast.
They then lease them back under terms that make your landlord look tame.
- Sale-leaseback transactions increased 47% from 2019
- Management contract revenue grew 32% year-over-year
- Asset-light operators now control 38% of market share
This financial engineering is unique. Companies pay rent to themselves and book management fees. It’s like charging yourself for breathing your own air.
The consolidation wave isn’t slowing down. Recent M&A activity shows operators buying competitors to sell their real estate. They keep the customer database and brand loyalty but dump the physical baggage.
This strategy has its perks. Companies maintain control without being tied to real estate. They can change direction quickly, like a craps dealer switching dice.
The consolidation trend also creates regional powerhouses. These companies manage multiple properties under one umbrella.
But there’s a catch. Long-term lease obligations can be a burden during downturns. Spreading management attention across many properties can also dilute the customer experience.
It’s like trying to date twenty properties at once.
The current consolidation phase is capitalism’s ultimate refinement. Why own the casino when you can profit from every aspect without the deed? It’s financial alchemy that turns liabilities into profit centers.
Pricing & Promotion Strategy vs Yield Management
Some casinos treat pricing like a Black Friday sale. But Wynn views it like a Michelin-starred chef making a tasting menu. This isn’t just about how they do things. It’s about their philosophy. Wynn sees its customers as connoisseurs, not just people.
Yield management in gaming isn’t about getting every last dollar. It’s about knowing when to charge more or less. Today, there are three main ways to do this:
- The Discount Dynamo: Casinos that think more coupons mean more customers
- The Balanced Act: Places that try to find a middle ground between cheap and expensive
- The Premium Player: Wynn focuses on the high-end market, playing a different game
After the pandemic, promotion wars got fiercer. Some casinos offer so many free things, it’s almost like socialism. Free play offers have jumped 37% in a year, and discounts on rooms are common.
Wynn’s strategy is different. They aim to be like a luxury brand, not just a casino. They don’t need to offer cheap deals because their guests want the best.
The numbers back up Wynn’s strategy. While other casinos’ hold percentages vary, Wynn keeps yields high with smart pricing. Their Wynn share of the premium market helps them avoid the discounting battles.
Wynn doesn’t ignore promotions completely. They use them carefully, like a sniper rifle. This approach keeps yields high and makes guests feel like they’re getting more value.
In the game of pricing and yield management, Wynn shows that sometimes the best promotion is no promotion at all. Their Wynn share of discerning customers lets them focus on quality over quantity. This way, they aim for sustainable yields, not just quick wins.
Forecast: Share Shifts Over Next 24 Months
Trying to predict the casino market is like guessing which slot machine will hit next. You can study patterns, but luck always wins. Analysts agree on some interesting changes in operator market share by 2026.
Wynn Resorts seems set to keep its luxury lead, like that friend who always wins at Monopoly. Their focus on high-end services creates a strong barrier against rivals. On the other hand, regional operators face a different challenge, with local market trends affecting their success.
2026 might be the year group business boosts Caesars and MGM out of their current slumps. Convention bookings and corporate events are coming back strong, like a blackjack player doubling down on 11.
We’ve gathered key predictions from top gaming analysts. These forecasts consider current trends, new property openings, and how much people spend.
| Operator | Current Market Share | 24-Month Projection | Key Growth Driver |
|---|---|---|---|
| Wynn Resorts | 12.4% | 13.1% | Premium segment retention |
| Caesars Entertainment | 18.7% | 20.2% | Convention business recovery |
| MGM Resorts | 22.3% | 23.8% | Integrated resort performance |
| Regional Operators | 31.5% | 29.8% | Local market saturation |
| Sportsbook Platforms | 8.1% | 9.5% | Mobile adoption acceleration |
The numbers show a slow move towards bigger players. Caesars and MGM could gain almost three percentage points, thanks to more group business and working together better.
Regional operators might lose a bit as people go back to big resorts. But their strong local ties help them stay steady.
Sports betting platforms are growing, but they face big challenges. Their progress is like a smart blackjack strategy, not a big risk like roulette.
The next two years could see big changes in who leads the casino market. While predictions are guesses, the trends suggest big shifts are coming.
Risks & Wildcards (new supply, macro, events)
Casino operators think they’ve got it all figured out, but reality throws a curveball. The gaming world is like a high-stakes poker game. The rules change right in the middle of the game.
New casinos entering the market are a big risk. When this happens, everyone’s share of the market gets smaller. It’s like when a new player joins the game, and everyone’s chips get diluted.
Macroeconomic factors are like that unpredictable uncle at Thanksgiving. They can disrupt everything. Interest rate hikes or a drop in consumer spending can make it hard to predict revenue.
Events can also cause big swings in revenue. Things like convention cancellations or weather emergencies can wipe out expected income quickly. It’s like a slot machine eating dollar bills fast.
The biggest risk is how these factors interact. For example, new casinos during a downturn can create a perfect storm. This makes consolidation strategies key for survival.
Executives face three main risks:
- Too many casinos in competitive markets
- Less spending by consumers
- Unexpected events that change everything overnight
The smart approach isn’t to avoid risks but to build strong operations. Because in this business, the only thing you can count on is uncertainty itself.
Data Appendix & Visualization Pack
For those who love numbers, this appendix is your paradise. We’ve gathered all the data, charts, and visuals on slot/table share. It’s like the special edition of casino economics, full of details for the true enthusiasts.
Here, you’ll find everything from hold percentage distributions to revenue breakdowns. It’s where we get really into the data, making Excel fans proud. The visuals bring stories to life that numbers alone can’t.
Our data comes from top sources like MGM Resorts and Caesars Entertainment. You’ll see trends and patterns clearly. It’s not just data—it’s insight with a dash of humor.
So, dive in, explore, and make your own discoveries. The numbers speak for themselves, but they also tell great stories.