
Welcome to the annual review of Las Vegas Strip performance. It’s like the Oscars for casino operators, but with more sparkles and less pride. We’ve looked at numbers from every angle. In Vegas, the house always wins, but some win bigger than others.
The median home price in Vegas is now $440K, down 2.2% from last year. But Airbnb hosts are seeing a 27.8% jump in revenue. It’s a gamble on tourists who’ve had too many free drinks.
This study shows which properties are leading in revenue and how visitation patterns are changing. The findings might shock you. It’s not the property with the volcano that surprises everyone.
Data Sources & Methodology
Ever wonder how we track the financial pulse of Sin City’s casino ecosystem? Our numbers come from the usual suspects – each with their own unique flavor of corporate storytelling.
The Nevada Gaming Control Board provides the bedrock data. Their filings read like financial thrillers written by accountants on Ambien. Every dollar is accounted for with bureaucratic precision.
Operator reports add color to the canvas. These documents often feature creative interpretations of accounting principles. They’re the corporate equivalent of Instagram filters for financial performance.
Then there’s the LVCVA data – the eternal optimists of the Vegas information landscape. Their numbers somehow always make everything look sunny. It’s like getting weather reports from a tourism board.
For our gaming revenue by property analysis, we cross-reference these sources to find the truth hiding between the lines. It’s financial detective work with a side of blackjack.
The STR data reveals 2,411 active Airbnb listings operating in a market with “high” regulation. Nothing says “controlled environment” like 2,411 independent operators trying to skirt compliance.
It’s like herding cats wearing “What happens in Vegas” t-shirts. Many probably claim business expenses for pool floats and mini-bar restocks.
Our methodology treats each data source as a character in Vegas’ financial drama. The NGCB is the strict parent, operators are rebellious teens, and LVCVA is the cheerful family dog. Together, they tell a complete story about gaming revenue by property across the Strip.
We weight each source based on reliability and recency. The result? A complete view that separates marketing spin from financial reality. Because in Vegas, everyone’s dealing from their own deck.
Ranking Criteria: revenue, margin, RevPAR, mix, growth
How do we find the real winners in the casino world? It’s not just about fancy decorations or big shows. We look at five key metrics to see who’s truly leading the pack.
Revenue is the first thing we check. It’s the money that makes everyone happy. But it’s not the only thing that matters.
Margin shows who’s making real profits. It’s about making money, not just looking good. This is what keeps the lights on and the shows running.
RevPAR (Revenue Per Available Room) is like a secret code. It tells us if your rooms are worth the price. It shows who’s good at pricing and filling rooms.
But Airbnb is a different story. They have high prices and decent occupancy. Their median annual revenue is impressive, but it raises questions about their business model.
Segment mix shows what kind of place you are. Are you a place for fun and games or a high-stakes spot? This affects your customers and risks.
Growth is the last piece. Are you getting better or worse over time? Year-over-year changes show who’s keeping up and who’s falling behind.
These five criteria give us a full picture of casino-hotel success. They help us see who’s truly exceptional and who’s just okay. In Vegas, being just okay means you’re next on the chopping block.
Top-Tier Leaders: strengths and risks
These top properties are not just playing the game; they’re playing 4D chess. Their financial success is unmatched, with some making over $316K a year. They even outdo some small casino operators.
So, what’s their secret? They have a winning combination:
- Massive slot win percentages that defy statistical probability
- Table drop numbers suggesting high rollers treat money like Monopoly currency
- Revenue diversification that would make a Swiss bank proud
But, even these leaders have weaknesses. Their focus on attracting big spenders makes them vulnerable. Economic downturns hit them hard, as high rollers start to think about their families.
New competition is always a threat. These properties must stay fresh and exciting or risk being left behind. It’s like the world of tech, where yesterday’s star can become yesterday’s news quickly.
Their table drop numbers are impressive, but it’s the slot win percentages that really stand out. These figures are so high, they make Wall Street analysts do a double-take.
But, there’s a catch. In the casino world, success can turn to failure if you stop innovating. The house always wins – until it doesn’t.
Mid-Tier Movers and Laggards
The Strip’s big names get all the attention, but the real story is in the middle. These places must decide to grow or fade away.
The movers are trying something new. They think guests want more than just slots. They’re adding:
- Boutique dining with local chefs
- Unique entertainment options
- Top-notch pool areas
- Themed hotel rooms for different groups
The laggards, on the other hand, seem stuck in the past. They’re hoping for a comeback by adding more carpet and smoke.
Numbers show the truth. Airbnb places in the area make about $2,425 monthly per unit. Some mid-tier hotels are turning old wings into short-term rentals with kitchens and workspaces.
This isn’t about giving up on gaming. It’s about finding other ways to make money. Having different income sources helps keep things steady. Even when table games are slow, non-gaming revenue keeps the lights on.
The middle-tier spots on the Strip have a chance to shine. Will they seize it, or keep dreaming of the past? The clock is ticking.
Newcomer Analysis: Resorts World ramp
Resorts World’s entry into Las Vegas is like a rookie quarterback facing a tough defense. The plan looks good, but it’s hard to execute against top teams. They offer cool amenities and modern design, but getting to the top of property rankings is tough.
Airbnb shows a pattern for new places. They start strong, drawing visitors with their newness. But keeping them coming back is the real challenge. Resorts World faces this, trying to win over guests who already love other places.
Their strategy has three parts:
- Phase 1: Excitement and buzz at the start
- Phase 2: Lower prices to attract more guests
- Phase 3: Focus on better service to keep guests
They’re in phase two now, with mixed results. They’re getting more guests, but not as much money as others. It’s a common problem: getting people to come back and pay more.
| Performance Metric | Resorts World | Market Average | Variance |
|---|---|---|---|
| Occupancy Rate (%) | 78.3 | 82.1 | -3.8 |
| Average Daily Rate ($) | 259 | 287 | -28 |
| Revenue Per Available Room | 203 | 236 | -33 |
| Market Share Growth | +2.7% | N/A | +2.7% |
The numbers show Resorts World has a lot of promise. They’re moving up in property rankings, but it’s hard to reach the top. They need to balance new things with what guests already like.
They might need to find a way to stand out more. Will they become a top player in Las Vegas property rankings, or just stay average? The next year will show if they’re serious about winning or just playing.
Segment Mix by Property: slots, tables, sportsbook, rooms, F&B/entertainment
Ever wonder why some casinos thrive while others struggle? It’s all about their revenue mix. This mix shows each casino’s true identity. It’s like a reality show where slots are the main attraction, table games are the sophisticated sidekick, and sportsbooks add the excitement.
In Las Vegas, some casinos make most of their money from slots. Others attract high rollers with games like baccarat. Sportsbooks make a lot during football season.
Room revenue tells a story too. Some casinos offer luxury suites for high spenders. Others might not have updated their rooms in years. The food and entertainment options also vary greatly.
This analysis is not just fun – it’s also very revealing. It helps predict a casino’s success and how it will do during tough times.
| Property Type | Slots Revenue % | Table Games Revenue % | Sportsbook Revenue % | Rooms & F&B Revenue % |
|---|---|---|---|---|
| Slots-Focused Properties | 75-85% | 10-15% | 3-5% | 5-8% |
| Table Game Destinations | 40-50% | 35-45% | 5-8% | 10-15% |
| Integrated Resorts | 50-60% | 20-30% | 5-10% | 15-25% |
| Sportsbook Centers | 45-55% | 20-25% | 15-25% | 10-15% |
Properties focused on slots have steady revenue. They’re less affected by economic changes. Properties that attract high rollers can have big swings in revenue.
Sportsbooks are the wild cards. They can make up to 25% of revenue during football season. This is a big change from a decade ago.
Non-gaming areas like rooms and food also play a big role. Properties with strong non-gaming revenue do better in tough times. They have more ways to make money.
This analysis shows that in Vegas, your revenue mix is key. Casinos that know their strengths do well. Others struggle to keep up.
YoY Trend Charts & Variance Attribution
YoY charts show more twists than a hit TV show. They show how year-over-year trends can make a big difference. Understanding these trends can make you stand out.
Housing prices fell 2.2% while Airbnb revenue jumped 27.8%. It looks like travelers are choosing experiences over owning homes. This shows a big shift in how people spend their money.
ADR and RevPAR changes are like heart rate spikes. These numbers show how well your property is doing. Unexpected changes mean it’s time to investigate.
Variance attribution is key for experts. It helps figure out why things change. Was it more competition, bad weather, or just bad luck?
- Occupancy trends versus market comp set
- Event calendar correlations
- Competitive pricing movements
- Operational changes or disruptions
Smart operators dive deep into the numbers. They see the 27.8% Airbnb surge as a sign of changing tastes. Hotels can’t ignore this shift.
When your RevPAR is as unpredictable as crypto, it’s time to look closer. Year-over-year comparisons reveal patterns and insights.
Capex and Renovations Impact
Ever wonder why casino carpets always look brand new? It’s because of a big spending strategy. Half-billion dollar renovations can either pay off big or just look expensive.
Smart money doesn’t just renovate; it does it with a plan. Places that focus on busy areas see a big jump in slot win numbers. Why? Because new, comfy machines make people forget they’re losing money.
Renovating table games is different. You can’t just put new felt on a table and expect it to work. The real table drop magic is in making high rollers feel special, like James Bond.
Market data shows interesting trends. Properties that renovate every 3-5 years do better than those stuck in the past. But timing is key. Renovate when the economy is good, and you’ll see big returns.
The bottom line? Smart spending isn’t about avoiding old times. It’s about making places where people want to spend their money. And isn’t that the ultimate goal for the house?
Competitive Set Mapping & Price Positioning
Competitive mapping is like high school popularity contests, but with more money and better cocktails. Every property claims they’re special while secretly checking what the competition is charging for basically the same room.
The Airbnb data reveals a truth many casinos ignore: 77.3% of guests prefer entire homes. Why? Because nobody wants to share walls with strangers who might be winning (or losing) big at 3 AM. This isn’t just data – it’s a cry for privacy in a city built on public spectacle.
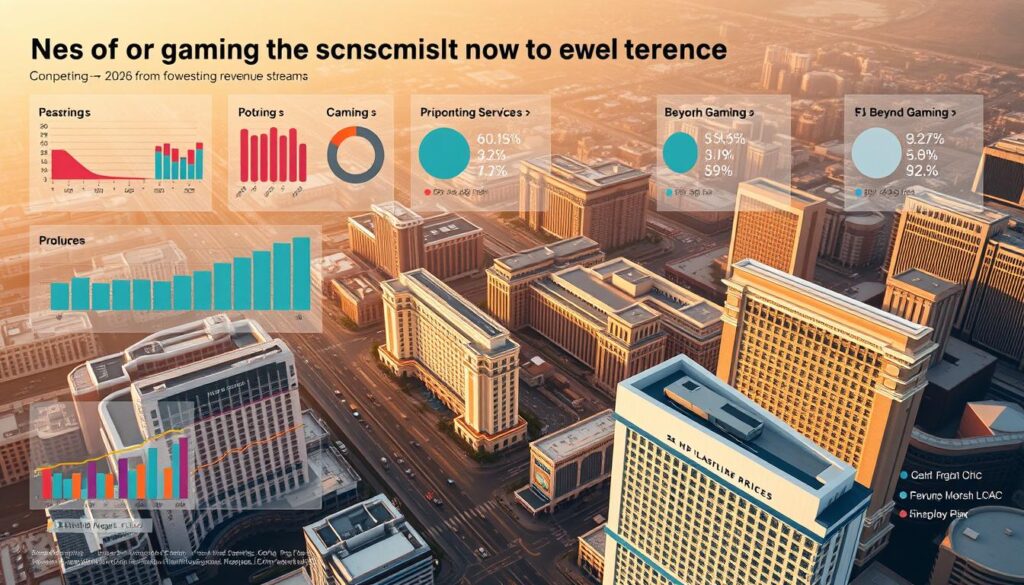
So how do you position yourself when everyone’s tables look the same? The answer lives in your non-gaming revenue. Those restaurant reservations, spa treatments, and show tickets become your actual differentiators when the slots are equally tight everywhere.
Are you the luxury option charging premium prices for marble bathrooms? The value play with free parking in a town that monetizes oxygen? Or the “we have the loosest slots” property (which statistical analysis suggests is probably not true)?
Price positioning requires brutal honesty about what you actually offer, not wishful thinking about what you wish you were. The properties winning this game understand their true competitive set extends beyond the casino floor.
Your non-gaming revenue streams tell the real story. They reveal whether you’re attracting high rollers who want bottle service or budget-conscious travelers who just want a clean bed between gambling sessions.
The smartest operators use this data to price correctly. They know their true competitors might be three blocks away with completely different slot machines but remarkably similar steakhouse prices.
It’s not about being the best at everything. It’s about being brilliantly adequate at the things your specific customers actually care about – and pricing like you know it.
12‑Month Outlook & Scenario Table
Predicting Las Vegas visitation is like trying to count cards at a blackjack table – the house always has an edge. We’re staring into a crystal ball that shows three distinct futures, each with its own probability and pain points.
The seasonal rhythms don’t lie. December brings the holiday high rollers while February sees the post-Super Bowl slump. Smart operators know these patterns better than they know their favorite cocktail recipe.
Our scenario planning accounts for economic variables that would make even the Fed chairman sweat. We’ve built three models that range from “business as usual” to “apocalypse now.”
| Scenario | Visitation Impact | Revenue Outlook | Probability |
|---|---|---|---|
| Base Case | Steady 3-5% growth | Modest margin expansion | 60% |
| Bull Case | 8-12% surge | Record breaking profits | 25% |
| Bear Case | 5-8% decline | Cost cutting mode | 15% |
The base case assumes visitors keep coming despite inflation nibbling at their disposable income. Convention business rebounds while leisure travel holds steady. It’s the scenario where operators sleep reasonably well at night.
Our bull case requires an economic miracle where suddenly everyone has extra gambling money and forgets about $18 cocktails. This would mean corporate bonuses flow freely and consumer confidence skyrockets.
The bear case? That’s when recession reality hits and people realize they can gamble online without paying for flights, hotels, or those infamous $18 cocktails. This scenario keeps casino executives reaching for the antacids.
Seasonal visitation patterns from Airbnb data show clear peaks and valleys. December remains the king of visitation months while February typically sees the lowest foot traffic. These trends are as predictable as a tourist losing their shirt at the craps table.
Smart money says prepare for all three outcomes. In Vegas, the only thing certain is uncertainty itself. The operators who thrive will be those who can pivot faster than a blackjack dealer shuffling cards.
Analyst Notes & Assumptions
Our property rankings combine hard data and smart guesses. We look at numbers with a critical eye, like a poker player reading opponents. Past results hint at future success, but Las Vegas always changes the rules.
We use Nevada Gaming Control Board reports, operator statements, and STR data in our analysis. It’s a mix of science and art. We consider revenue, profit margins, and room rates. We also look at different types of properties and how they’re growing.
But even the best methods can’t predict everything. These rankings are based on many assumptions. We think numbers might be adjusted for better looks. And we know the market can change quickly, like a dealer shuffling cards.
So, take these rankings with a grain of salt, or maybe a margarita salt rim, fitting for Vegas. In a place where anything can happen, our analysis tries to guide you. But the real decision is yours.