Let’s dive into a question that keeps CFOs up at night. When 300,000 people come to the Strip for sports events, who pays the most? The Super Bowl, March Madness, and F1 races bring excitement, like a Bond villain party with private jets.
The boardroom often talks about the “mass market uplift.” But the numbers show a different truth. On one hand, we have the whales—high-rollers who send millions before they even arrive. On the other, day-trippers and regular visitors fight for a $25 table and pay high for MGM Grand rooms.
As tourism numbers drop, gaming revenue goes up. This shows a golden age in real-time. It’s not just about counting people; it’s about their money. The debate between high-stakes players and everyday gamblers is key to Vegas’s cash flow.
For more on how different visitors affect gaming, read this article on gaming spend dynamics.
Definitions and segment cuts whales premium mass core mass day trippers
Let’s look at the key players in Vegas, from whales to day trippers. Knowing these groups helps us understand how casinos work. Each group changes the gaming experience, affecting everything from table drop to slot coin in.
Whales and the Super VIP Ecosystem
Whales are the heart of casinos. They view a $5,000 chip as just a tool in their game. Their spending shapes the luxury of casino properties. Analyst Barry Jonas says wealthy Europeans often seek luxury during big events like CES.
The Credit Line Litmus Test
For whales, the credit line is key. It shows their willingness to risk. A high credit line means confidence, while a low one might scare them off.
Premium Mass and the Upper-Middle Squeeze
The premium mass segment is caught in an economic squeeze. They enjoy first-class travel but are careful with money. They might spend $500 on baccarat but not on a $50 buffet.
Identifying the “Discretionary but Dangerous” Player
These players spend on a whim, making casinos unpredictable. Their spending changes with the economy. The rich get richer, leaving others struggling.
Core Mass and the Day Tripper Calculus
Core mass players are the heart of Vegas. They love slots and buffets. Day trippers, like those from California, spend what they have and then go home.
When ADR Becomes a Barrier to Entry
Day trippers face high costs as ADRs rise. They might not be able to afford the luxury. This shows a class struggle in Vegas.
Understanding these segments is key to success in Vegas. Footfall alone won’t cut it. For more on segment benchmarks, see why benchmarking these hubs is important.
KPI stack theo ADT trip frequency win per visitor hold length of stay cross spend
KPIs are key in gaming, guiding revenue flow. They include metrics like ADT, which promises profits. MGM’s Bill Hornbuckle saw a 50% increase in theoretical win during a weekend. Yet, luck can change, and profits can drop.
Theoretical Win and the Art of the Expected Value
Theoretical win is a dream for casino execs. But, it’s just a projection. Real results can vary a lot. A big win can actually hurt the casino’s bottom line.
Why ADT is a Vanity Metric Without Context
ADT can be misleading without context. It’s not just about spending. It’s about loyalty and how often players return. A big spender might only come back for special events.
Trip Frequency and the Loyalty Loop
Trip frequency is vital for casino revenue. The more players visit, the more they spend. But, keeping players coming back is the real challenge. Casinos must offer more than just games.
Cross Spend as the Ultimate Profit Multiplier
Cross spend is where the magic is. Imagine a fan spending on a suite, dining, and then gambling. This boosts revenue and the local economy. It’s about creating memorable experiences.
Hold Percentage and the Volatility of Short Stays
Hold percentage shows the risk of short stays. A guest who stays briefly but spends little is not profitable. Casinos must balance attracting big spenders with ensuring they play.
Length of Stay vs. Intensity of Play
Length of stay and play intensity are key. A long stay doesn’t always mean more spending. It’s finding the right balance of time, engagement, and spending.
| Metric | Definition | Importance |
|---|---|---|
| Theoretical Win | Projected revenue from a player | Guides strategic planning |
| ADT | Average Daily Theoretical revenue | Indicates player value |
| Trip Frequency | How often a player visits | Measures loyalty |
| Hold Percentage | Revenue retained from bets | Reflects profitability |
| Cross Spend | Spending beyond gaming | Boosts overall revenue |

Event overlay Super Bowl March Madness UFC fight weeks uplift by segment
The Super Bowl, March Madness, and UFC fight weeks show different effects on Vegas revenue. Not every big weekend is the same. Calling a weekend the “Super Bowl” might sound exciting, but the real numbers often tell a different story.
The Super Bowl attracts many people, but they might not be the best for casinos. These fans often spend little but drink a lot. In contrast, F1 events draw wealthier, international visitors who spend more.
Super Bowl Weekend Revenue and the “Day Tripper” Myth
Super Bowl weekend sees a lot of people coming in, but high rollers might stay away. They prefer quieter places to gamble. This is because the premium mass players and whales like a calm environment.
The Private Jet Index vs. Allegiant Air Traffic
The Private Jet Index shows a rise in wealthy visitors for the Super Bowl. But Allegiant Air brings in more casual fans. This shows two different types of visitors with different reasons for coming.
March Madness and the Mass Market Mirage
March Madness is all about the excitement of young people in sportsbooks. But the actual money spent is often low. It’s a lot of noise with little substance.
Sportsbook Footprint vs. High Limit Isolation
During March Madness, sportsbooks get very busy. But high limit areas stay quiet. The big crowds are drawn to betting on games, but the high rollers prefer quieter spots.
UFC Fight Weeks and the International Premium Mass Surge
UFC fight weeks are a big deal. They attract a special kind of gambler. These international premium mass players are eager to bet and gamble.
The “Conor McGregor” Elasticity Effect
When a big name like Conor McGregor fights, demand for high stakes betting goes up. This shows how some events can really draw in the big spenders. It’s a big difference from the Super Bowl crowd.
Tables vs slots high limit baccarat vs penny slots elasticity and volatility
In the casino, tables and slots have their own roles. High limit baccarat tables offer big risks and rewards. Penny slots, on the other hand, provide steady play. This section explores how these games affect casino earnings.
The Baccarat Pit and the Whale’s Playground
Entering the baccarat pit is like stepping into a world for the elite. The stakes are high, and players, known as “whales,” play with confidence. A single shoe can change a quarter’s earnings in minutes.
Why a Single Shoe Can Swing a Quarter’s EBITDA
A single shoe can greatly affect earnings. A whale’s loss can drop revenue, while a win can boost it. This makes high limit rooms key for casinos.
Penny Slots and the Volume Game
Penny slots attract a different crowd, looking for low volatility. Players focus on playing a lot, not betting big. But, is the volatility really low?
The Illusion of Low Volatility in Mass Floor Aggregates
Penny slots seem to offer low volatility, but it’s not always true. The high volume of play can lead to big losses over time. The “slot coin in” metric shows the ongoing play, not a quick win.
Elasticity of Demand Across Game Types
The demand for high limit baccarat is unique. Raise the minimum bet, and whales might bet even more. But, raising a penny slot’s denomination by a cent can upset players.
When a $500 Minimum is Actually a Bargain
A $500 minimum can seem like a good deal in the high limit room. Whales are not scared of high stakes. This shows how different players react to prices, affecting casino earnings.
| Game Type | Average Bet | Volatility | Elasticity of Demand |
|---|---|---|---|
| High Limit Baccarat | $10,000+ | High | Inverted |
| Penny Slots | $0.01 | Low | Standard |
| Table Drop | Variable | Variable | High |
| Slot Coin In | Variable | Low | Low |
In conclusion, high limit baccarat and penny slots show a complex mix of volatility and elasticity. On big sports weekends, tables are key for bonuses. For more on slot machine volatility, see this resource.

Capacity constraints HL room seats minimums dealer staffing queue models
In the world of high stakes gambling, the high limit room’s capacity can be a big problem. Every weekend, the room is packed with players, making seats hard to find. Unlike a nightclub, a baccarat table has only a few spots.
For many Asian premium mass players, seat number 8 is very special. It’s like a sacred place.
The Physics of the High Limit Room
Let’s talk about the art of the squeeze. Operators face a big challenge: finding a balance between demand and space. The high limit room is very appealing, but without a seat, it’s like nothing at all.
It’s all about how things look. If a whale can’t get a seat, they might go somewhere else.
Seat Scarcity and the Art of the “Squeeze”
When the stakes are high, time is very important. If a whale has to wait too long, they might leave. Managing seat scarcity is key.
Operators need to use every inch of space well. They must make players feel important and valued.
Dealer Staffing and the Labor-Intensive Weekend
Now, let’s talk about dealer staffing. The weekend rush is very demanding. High-end visitors expect excellent service, and slow dealers can be costly.
They can waste a lot of time, and for high rollers, time is very valuable.
Why a Slow Dealer Costs More Than a Bad Beat
Imagine a whale waiting for a slow dealer. This not only frustrates the player but also slows down the game. Operators must make sure there are enough dealers, even during busy times.
Queue Models and the Cost of Waiting
Now, let’s look at queue models. How long will a whale wait before they go to the Wynn instead? The 15-minute rule is a big deal in gambling.
If players feel they’re wasting time, they might leave for another place.
The 15-Minute Rule and Player Defection
Understanding waiting time is key. If you can’t open a new table fast, you lose more than just money. You also lose respect.
The luxury world is tough, and every detail counts in the high limit room.
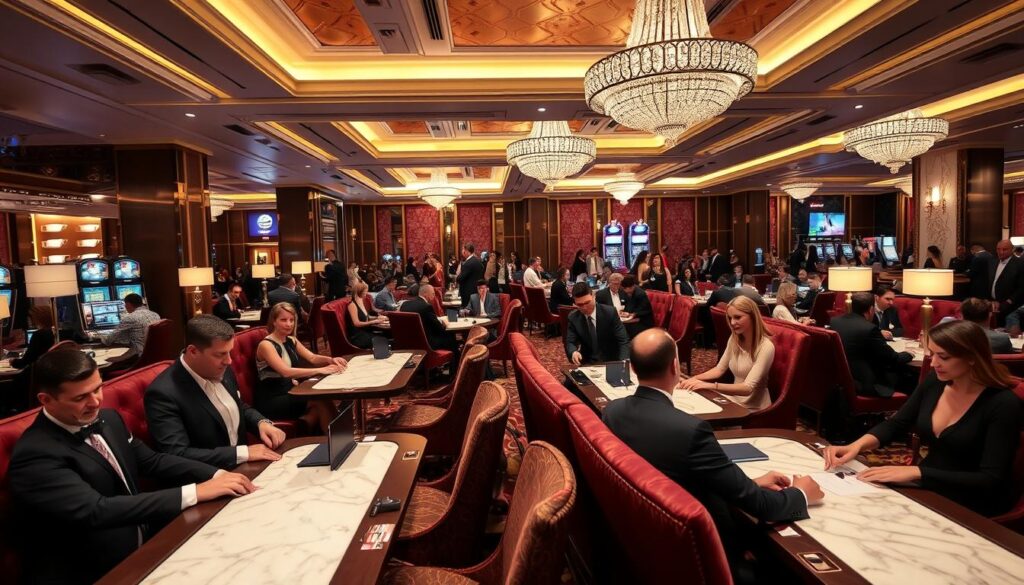
Offer strategy comp thresholds reinvestment percent bounce back windows
Creating irresistible offers is more than just simple math. It’s where numbers meet creativity. Knowing how to use offers can turn a one-time visitor into a loyal player.
The Mathematics of “Free”
Let’s explore what makes a comp offer appealing. The reinvestment percent is key. For whales, it’s 10% and a private jet. For regular players, it’s a free meal.
This shows how different players need different approaches to feel valued.
Reinvestment Percent and the Profitability Mirage
The reinvestment percent is more than a number; it’s a strategy. The goal is to keep offers from cutting into profits. Giving a $2,000 suite to a player with a $50,000 loss isn’t kindness; it’s smart business.
Comp Thresholds for the Premium Mass vs. the Core Player
Knowing comp thresholds is key. Premium players want unique experiences. A suite upgrade can make a visit unforgettable, encouraging them to come back.
Core players might prefer smaller perks, but their loyalty is just as important.
The Suite Upgrade as a Behavioral Trigger
Offering a suite upgrade can turn a regular visit into a special one. This boosts the chance of return visits and makes premium players feel valued.
Bounce Back Windows and the Calendar Trap
Bounce back windows are vital for keeping players interested. They prevent “pull-forward” issues, like the F1 race taking away from Super Bowl plans. If offers don’t have a clear end date, they just help players with plans they already had.
Why the Super Bowl Guest Needs a March Madness Offer
Premium players need to feel the urgency. “Come back for March Madness, Mr. Chen, and the villa is yours again.” It’s not just a deal; it’s a story of loyalty.
Compliance and credit markers front money wires cage lines during events
Before the games start, the compliance team has already made their move. In high limit rooms, it’s not just about money. It’s about following rules and building trust. The front money and credit markers are key, not just numbers.
The Front Money Protocol and the “Sight Draft” Era
Imagine a player sending $2 million to the cage before they even arrive. It’s not just a financial move. It shows confidence and sets the stage for big games. But during big events, the cage lines can get really busy.
Why a Wire Transfer is a Love Letter
When a player wires money, they’re making a big statement. It’s like saying, “I’m all in.” But it comes with its own set of challenges. The volume of transactions during big events can be overwhelming.
Cage Lines and the Liquidity Squeeze
During big events, the cage is under a lot of pressure. You can’t just dump cash on the counter. There are limits, insurance, and FinCEN watching. The amounts of money involved can be huge.
The Physical Cash Problem During Peak Events
As more people come, the challenges grow. It’s not just about the money. It’s about how to handle it all. Any mistake could lead to big problems.
Credit Markers and the Regulatory Tightrope
Credit markers are like short-term loans for gamblers. They’re based on trust. If you mess up the Know Your Customer (KYC) process, you could face big trouble. Compliance is key to avoiding disaster.
Know Your Customer in the Age of the Oligarch
In today’s world, knowing your customer is more important than ever. With players like oligarchs, the stakes are high. The consequences of mistakes are severe.
Modeling framework difference in differences event weekends vs controls
In Las Vegas, the “Difference in Differences” model is key. It helps us see the real effect of big events like the Super Bowl and F1 race. We learn if these events bring in new money or just move it around.
The “Difference in Differences” Methodology
We start by removing the Vegas Baseline. This baseline shows the usual weekend revenue. By comparing event weekends to regular ones, we find out if the Super Bowl weekend’s revenue is real or not. The F1 race, happening on a slow weekend before Thanksgiving, is perfect for this study.
Isolating the Event Effect from the “Vegas Baseline”
Looking at table drop and slot coin in for the last five years helps. It shows the real economic effect, without the usual confusion.
Control Group Selection and the Calendar Challenge
Picking the right control group is key. If we’re not careful, our data could be wrong. For example, comparing this year’s Super Bowl weekend to last year’s might be misleading. The calendar can make it seem like we’re growing when we’re not.
Why Last Year’s Same Weekend is a Terrible Comparison
Using last year’s data as a control can lead to wrong conclusions. We must ask if we’re really growing or just moving money around. This is the pull-forward effect that affects event modeling.
Applying the Model to F1 and the Super Bowl
Applying the model to events like the F1 race and the Super Bowl reveals more. The F1 race, on a quiet weekend, makes analysis easier. But the Super Bowl, in a busy month, makes things more complicated.
The “Net New” Revenue vs. Cannibalization Debate
The big question is: did the Super Bowl add net new revenue or just take from other weekends? This debate is important for understanding the future of Vegas events. The right analysis can help Vegas keep growing.
Case snapshot two Super Bowls HL drop trend vs mass coin in for 3 resorts
Imagine the Strip during two Super Bowls. Three resorts show different fortunes. Each resort has its own way to make money, showing the power of high limit rooms and mass market strategies.
Resort A and the High Limit Dependency
Resort A is all about big bets. Their high limit room lives and dies with the whales. The baccarat table drop is like a rollercoaster, with huge spikes and deep drops.
When there’s a 20% drop in baccarat, it’s a big problem. It’s not just a small issue; it’s a major loss.
When a 20% Drop in Baccarat Kills the Quarter
High rollers are a gamble for Resort A. Without them, the resort’s money troubles start. This gamble is as risky as betting everything on one number.
Resort B and the Mass Market Volume Shield
Resort B is the opposite, focusing on lots of players. Their slot coin in numbers go up slowly but steadily. They may not get the headlines, but they keep making money.
The Slot Floor as a Recession Hedge
This resort is safe during tough times. Their slot machines keep running, protecting them from financial storms.
Resort C and the Hybrid Premium Mass Surge
Resort C is a mix of both worlds. They find the perfect balance. They have enough table drop to impress and enough variety to stay safe.
The “Goldilocks” Zone of Table Games
By appealing to many, Resort C avoids big risks. This flexible approach shows the importance of being adaptable in Las Vegas.
Implications for next calendar and staffing
The dust has settled after another whirlwind of events, and now the real challenge begins. Many in the industry fall into the trap of thinking every day can feel like Super Bowl weekend. This “Permanent High Season” mindset is a surefire way to drain resources faster than a whale at a high-limit table.
You can’t afford to staff like it’s a major event every Tuesday. That approach leads to unnecessary labor costs that can cripple your budget.
The “Permanent High Season” Fallacy
Understanding the rhythms of the gaming calendar is key. The Culinary Union’s recent deals, inked just before F1, highlight the need for strategic labor contracts. This isn’t just about filling seats; it’s about managing costs while maximizing profitability.
Each event has its own dynamics, and knowing when to ramp up staffing is essential.
Labor Contracts and the Union Variable
The timing of labor agreements can make or break your operational strategy. The Culinary Union’s F1 timing serves as a reminder that the cost of labor peace is now a line item in your event budget. A well-timed contract can provide stability and efficiency.
This allows you to focus on attracting those premium mass players.
Strategic Calendar Planning and the “Anchor Event” Theory
Looking ahead, adopting the “Anchor Event” theory is key. By locking in whales and premium mass players for events like F1, you can create a ripple effect leading into Super Bowl weekend revenue peaks. This strategic approach allows for better resource allocation.
It gives your staff a much-needed break during quieter months. The calendar is more than just dates; it’s a liquidity map that dictates success.